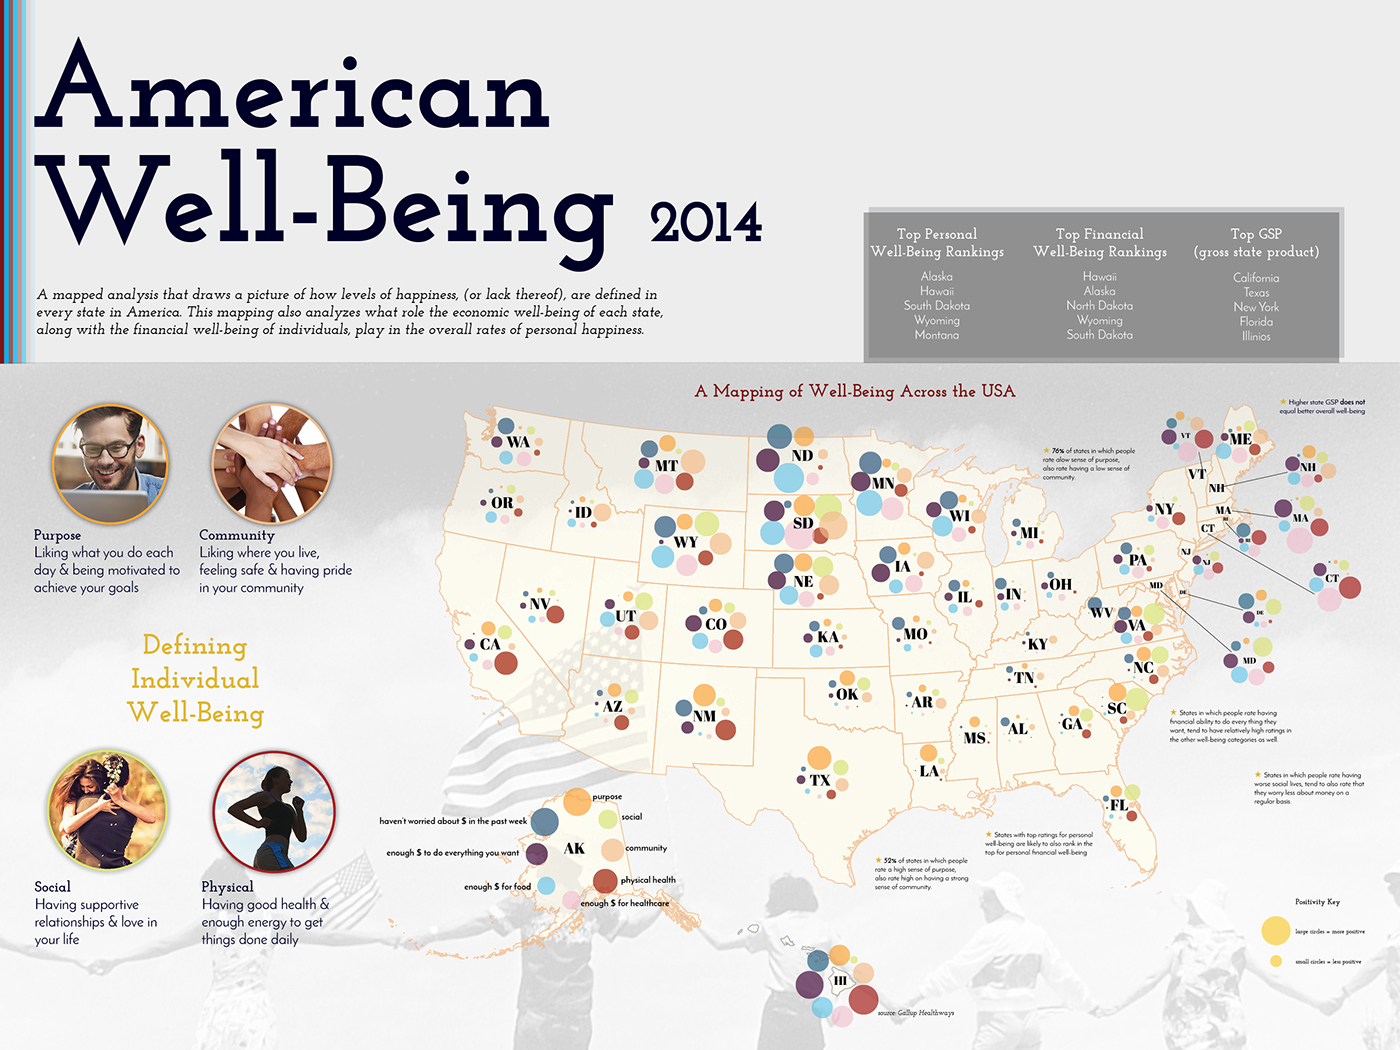
A mapped infographic analysis, that draws a picture of how levels of happiness, (or lack thereof), are defined in every state in America. This mapping also analyzes what role the economic well-being of each state, along with the financial well-being of individuals, play in the overall rates of personal happiness. To create this infographic map, I analyzed the 2014 Gallup survey data on well-being in the United States, and combined all the different categories into one comprehensive infographic, so the differences from one state to another can be clearly visualized. Combining all the data sets into one visualization also allows for finding interesting patterns in the data, which I also call attention to within this poster.