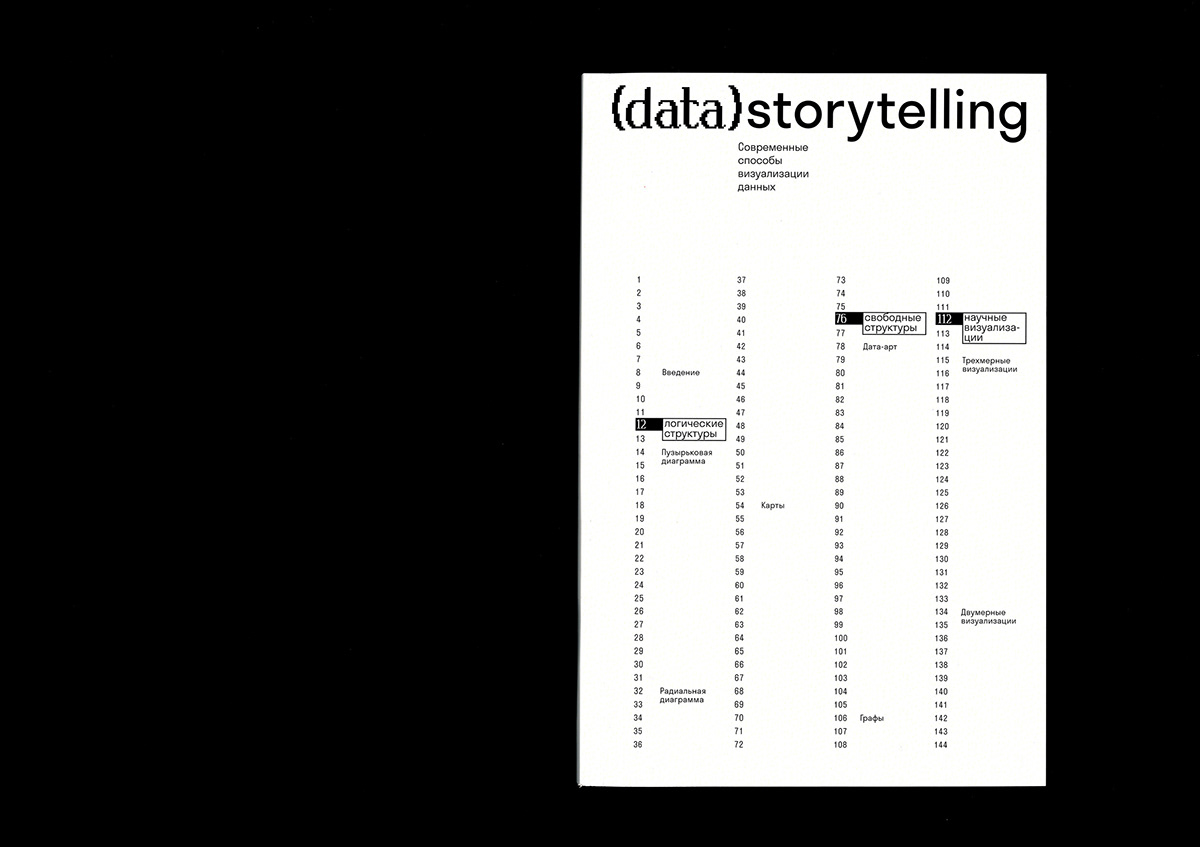


A visual study dedicated to the modern visualization techniques. There are 3 sections in the book: logical structures, free structures and scientific visualizations. In the publication infographics is considered to be an absolutely independent phenomenon, capable of not only visualizing the collected data, but also creating complex narratives, going beyond the statistical field in the art (artistic) field.

