Infographic – Print – Digital
Manulife infographic collection and communication
–
Manulife
–
Manulife
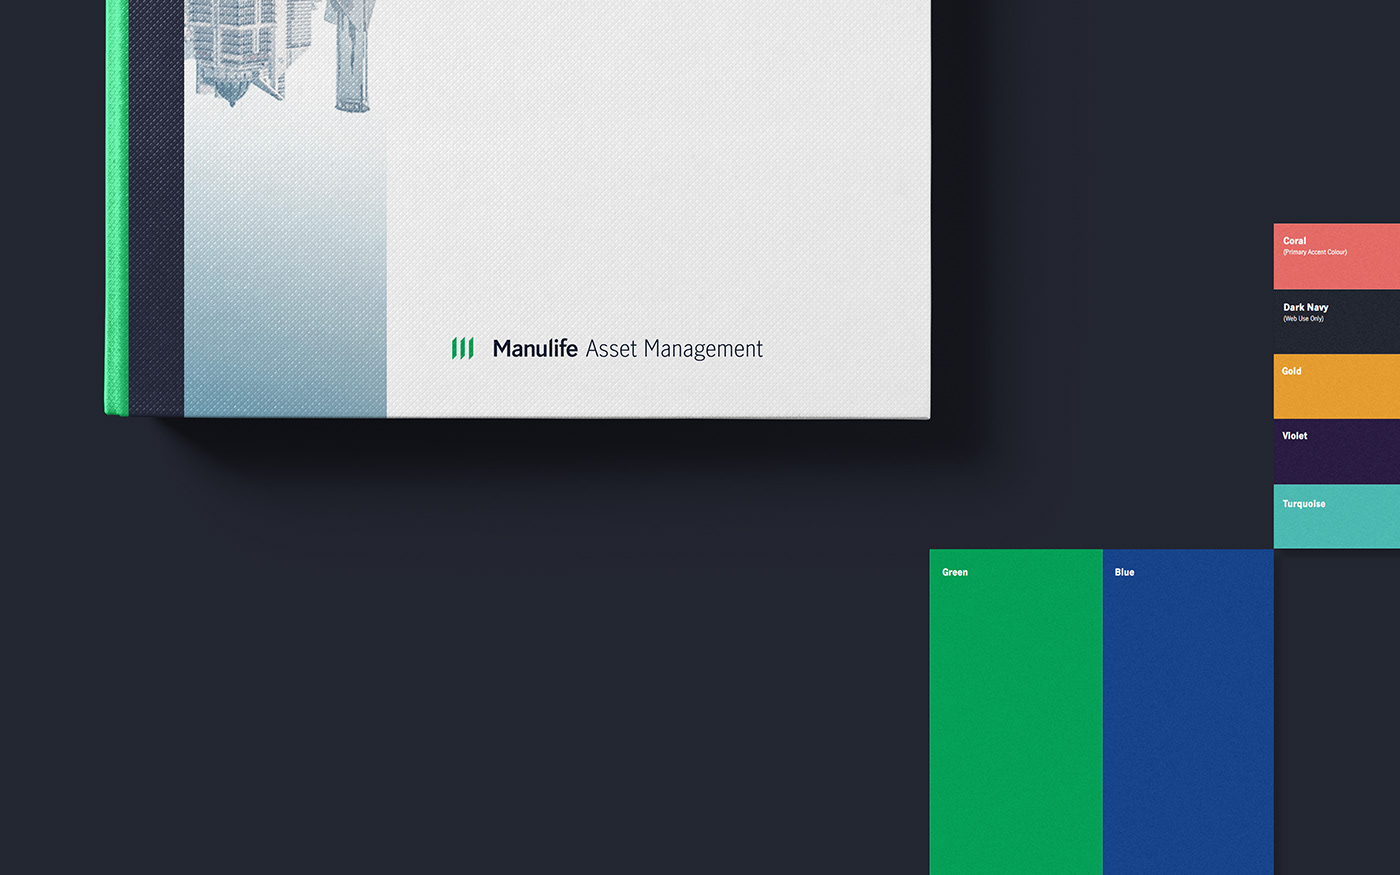
Upon the latest rebranding of Manulife, we've created a new and comprehensive set of infographics for Manulife Asset Management's print and digital collaterals. The complex datas are simplified and visualized with bold design language, paired with vibrant colour palette. This helps to freshen up the overall brand image and readability.
Visualization of the infos and datas includes illustration, bar charts, line graphs, pie charts, scatter plot, histogram, numeral display, stem and plot, pictograms, timeline, flow charts, frequency curve, frequency polygon and various types of infographics.
Visualization of the infos and datas includes illustration, bar charts, line graphs, pie charts, scatter plot, histogram, numeral display, stem and plot, pictograms, timeline, flow charts, frequency curve, frequency polygon and various types of infographics.