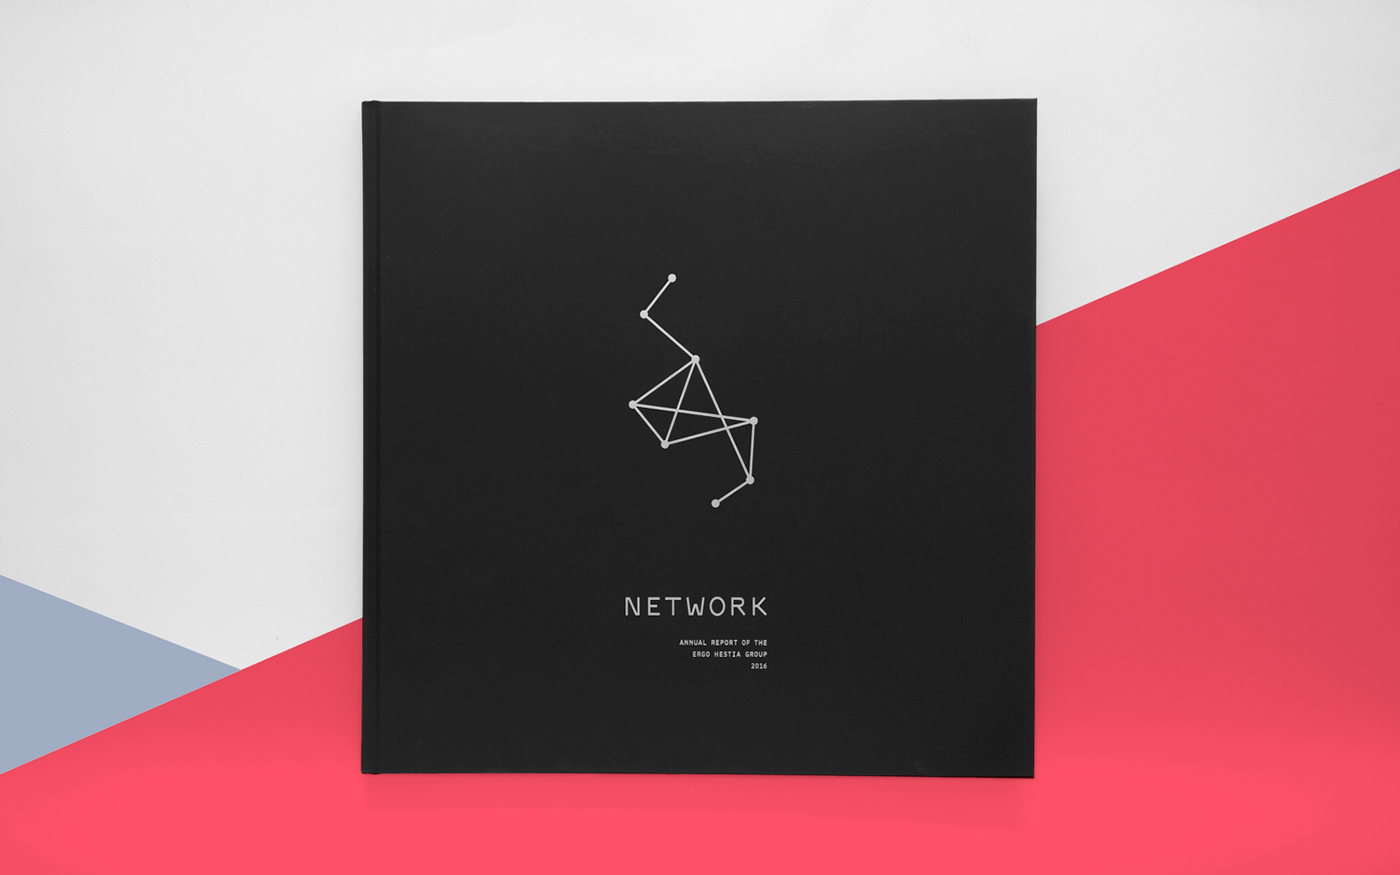
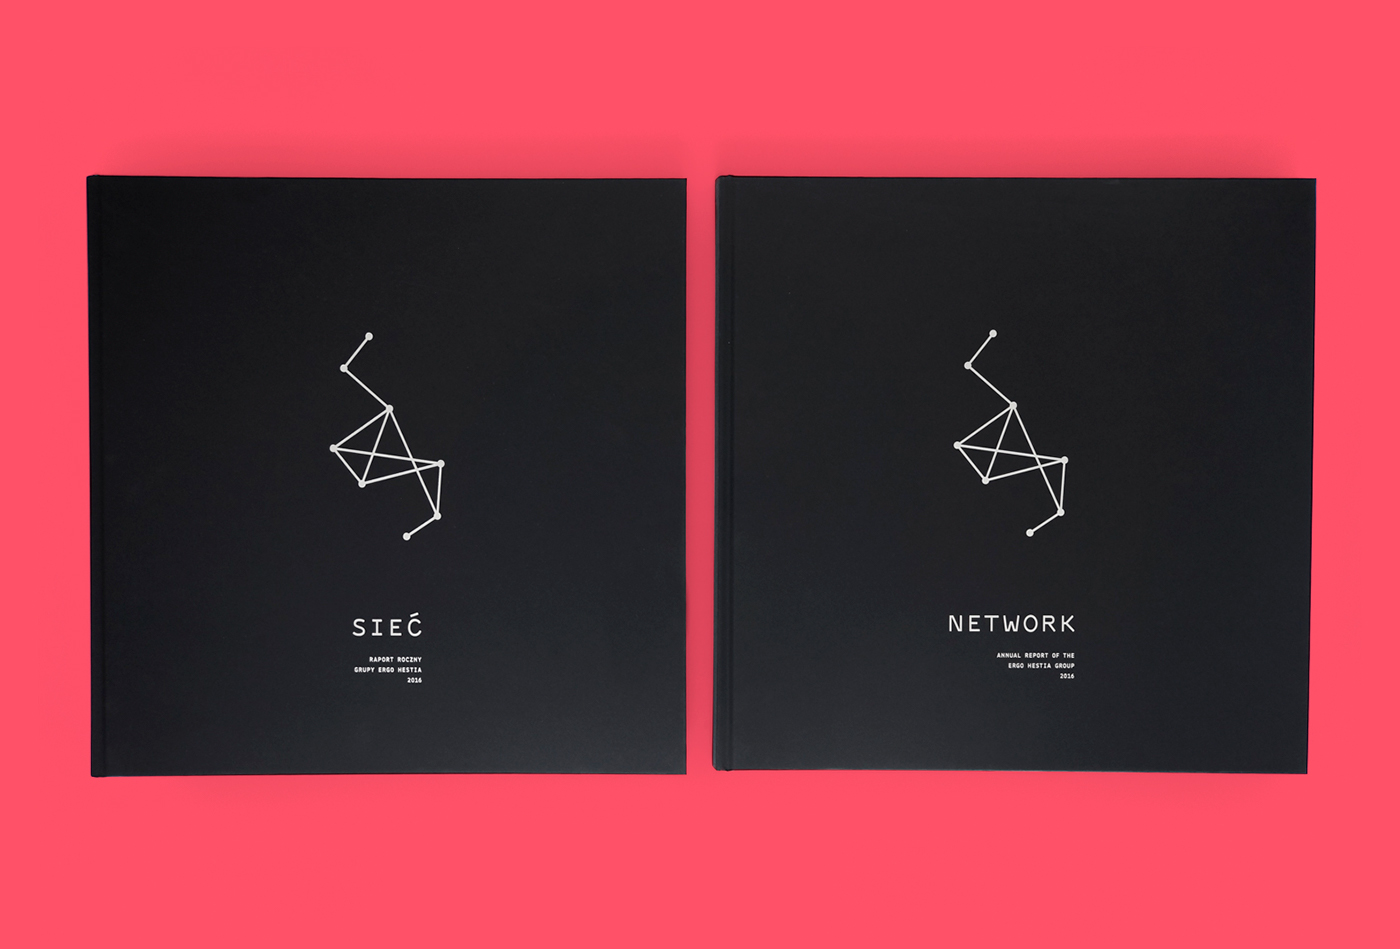
The Annual Report of the ERGO Hestia Group
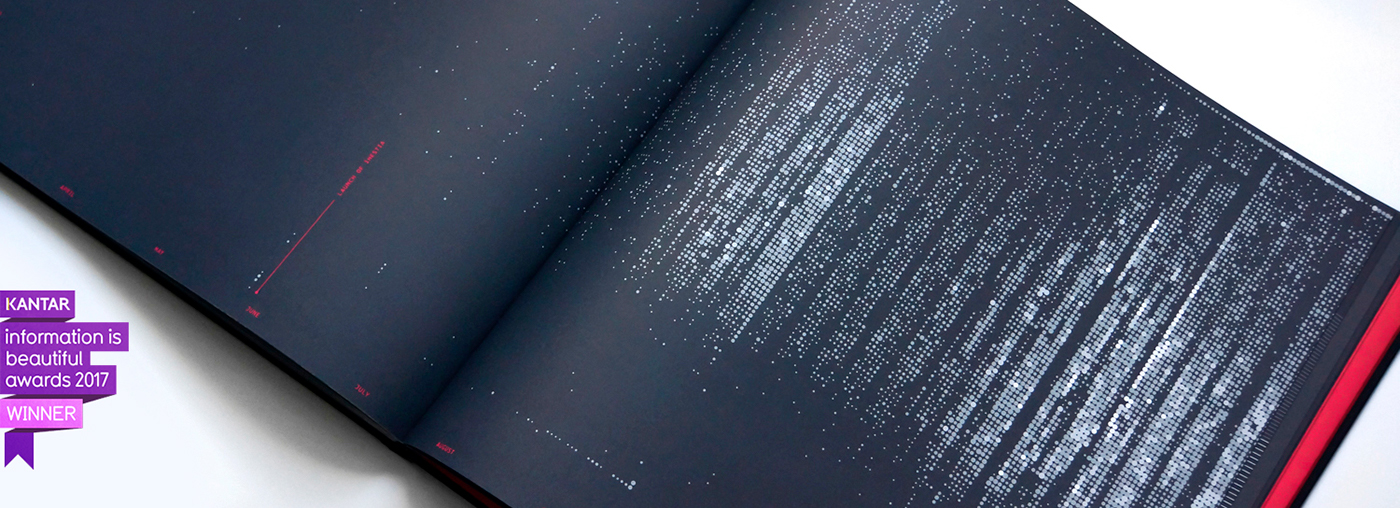
Awarded "Visitor's Vote" 1st prize in The Kantar Information is Beautiful Awards
Merit Award in HOW International Design Awards
Semifinalist of Adobe Design Achievement Awards
Merit Award in Polish Graphic Design Awards
Bronze Prize in KTR (Klub Twórców Reklamy)
Nomination in Project of the Year
Awarded 1st prize in AGAPE: The Best Corporate Designs Competition
Awarded in See&Say portfolio review
As a consequence of the award in Hestia Artistic Journey Contest I had the pleasure of collaborating with ERGO Hestia Group on the 2016 year’s issue of the Annual Report.
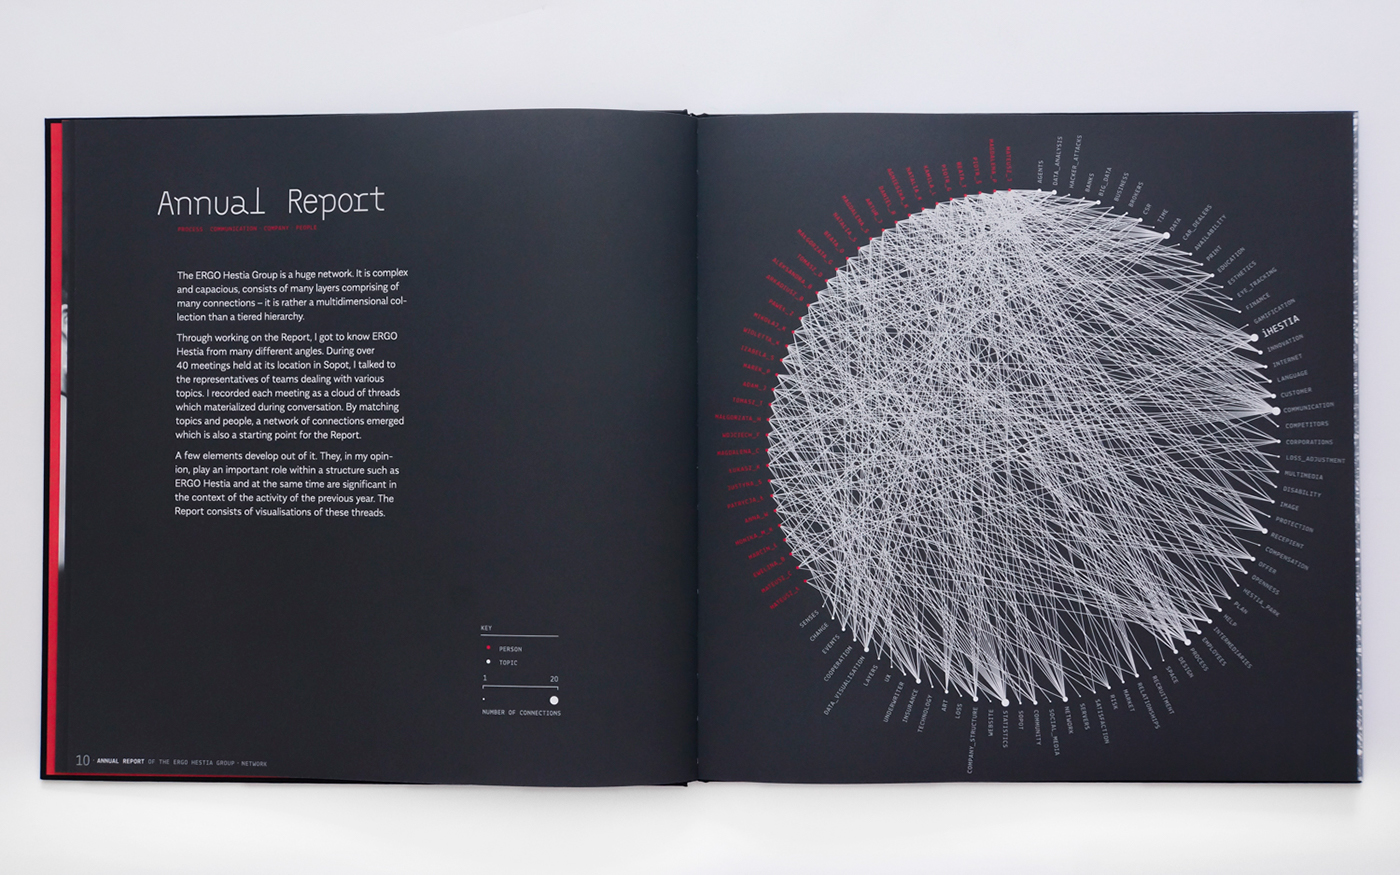
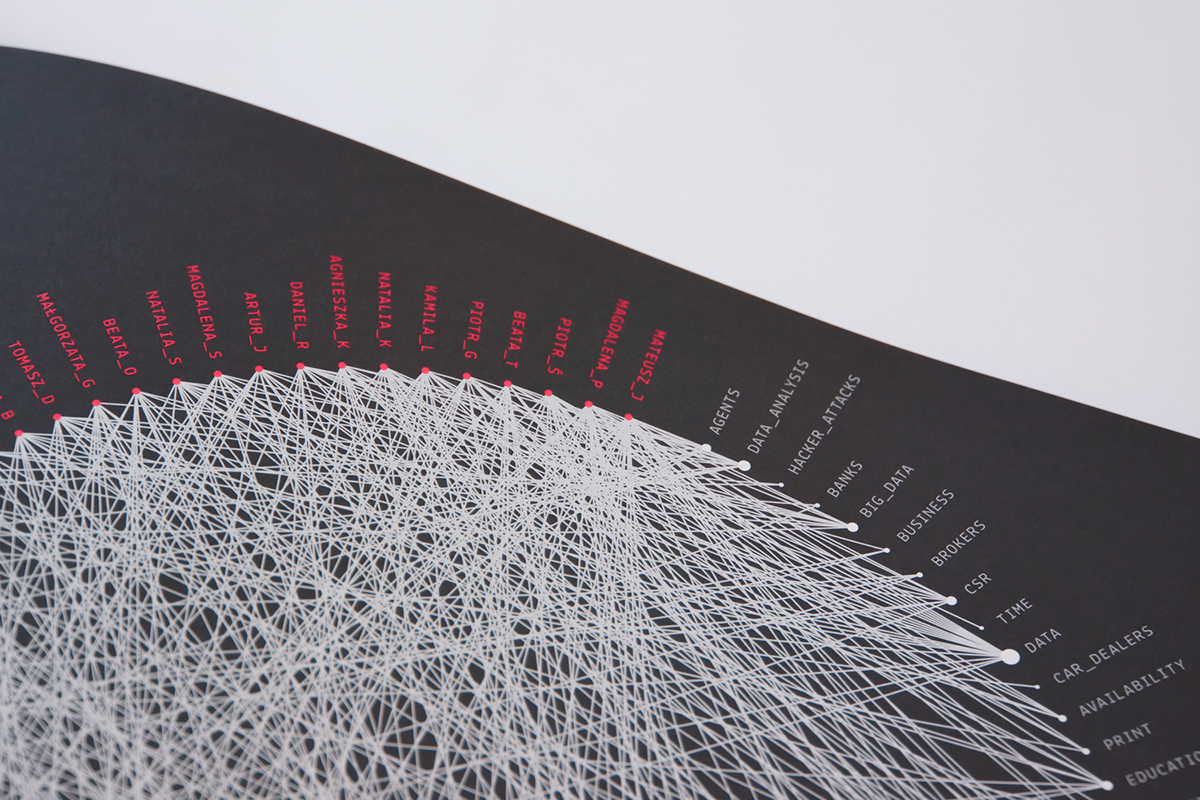
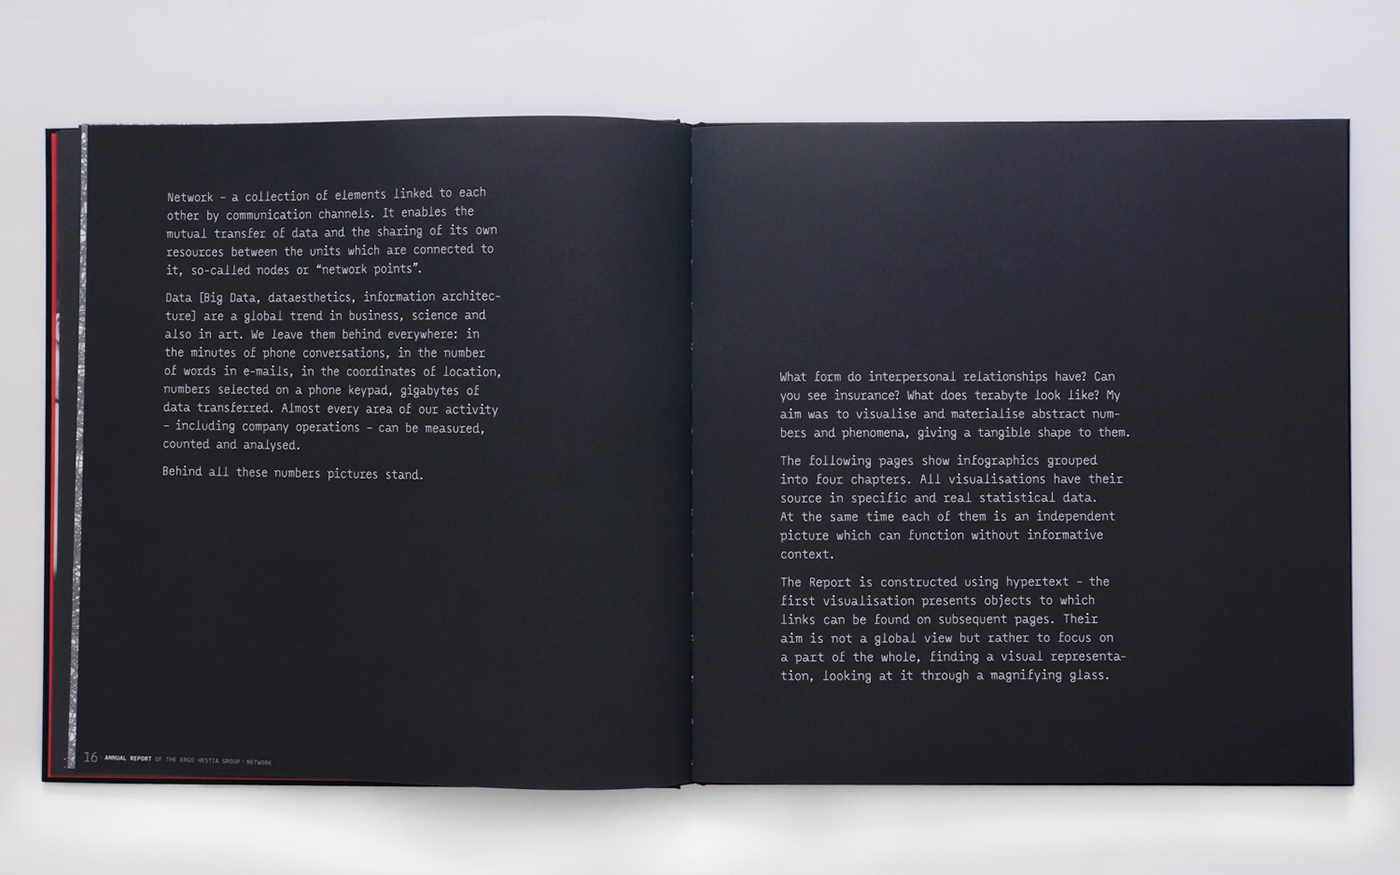
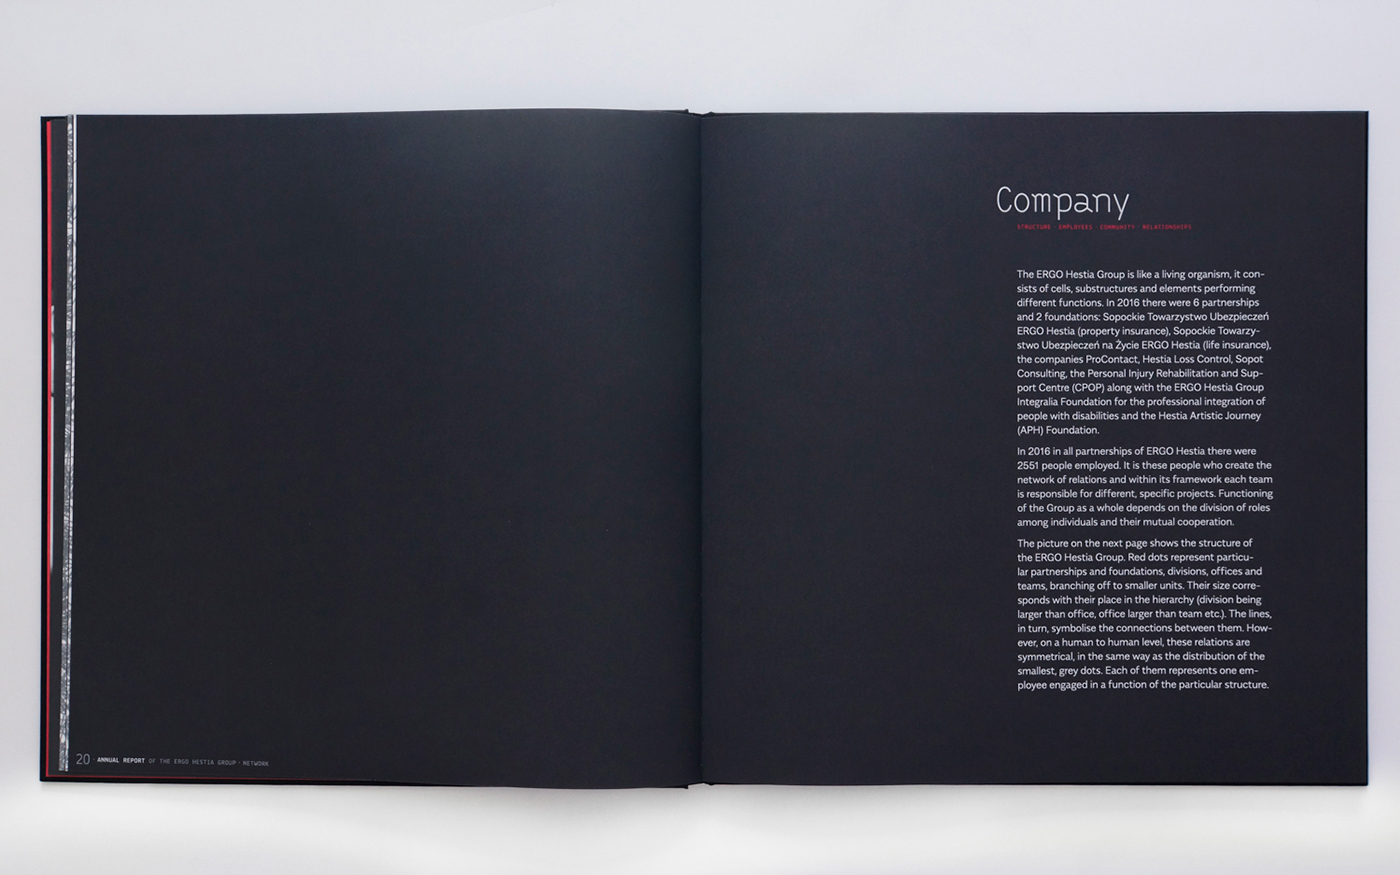
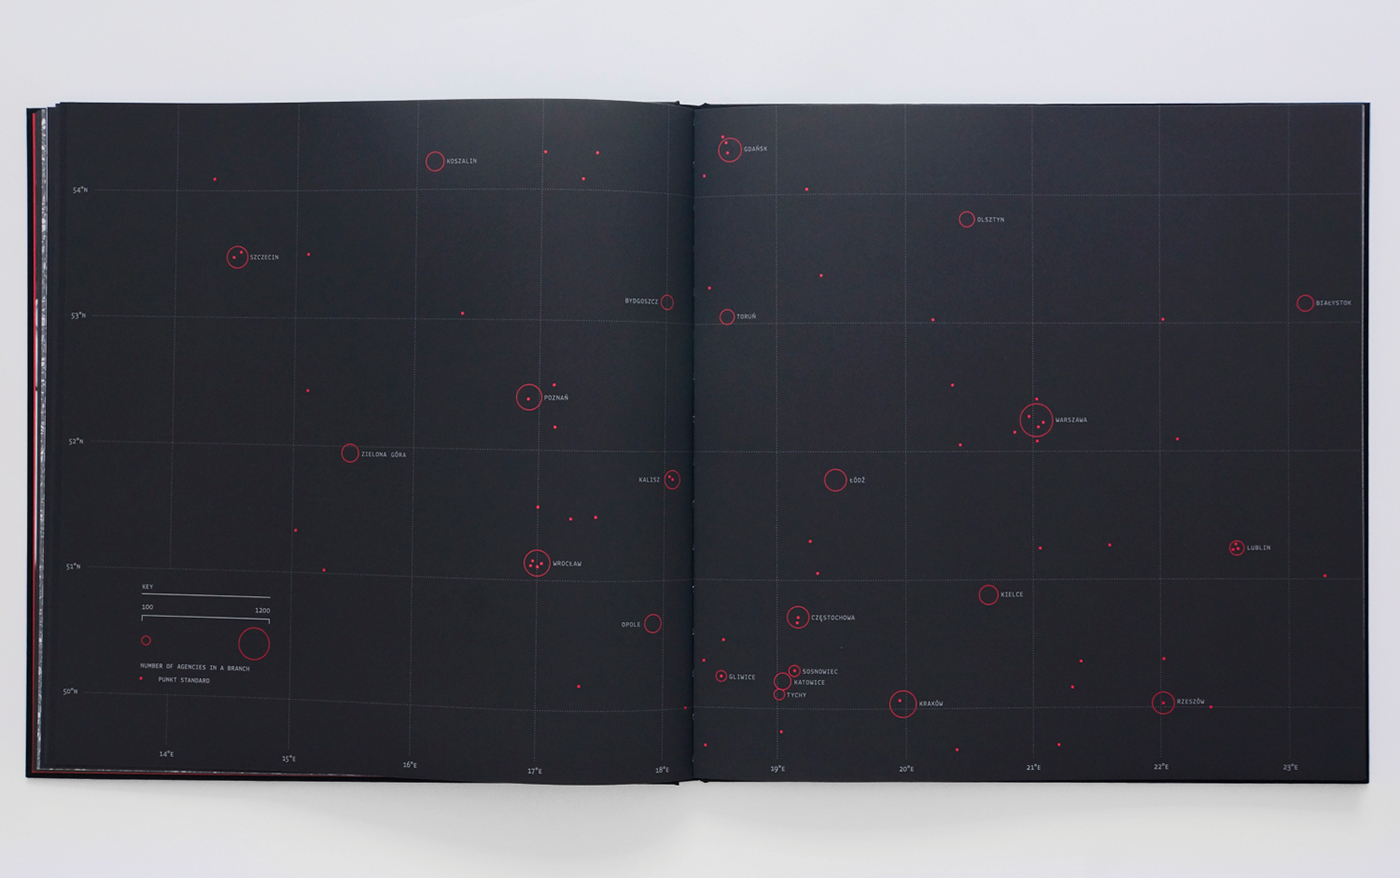
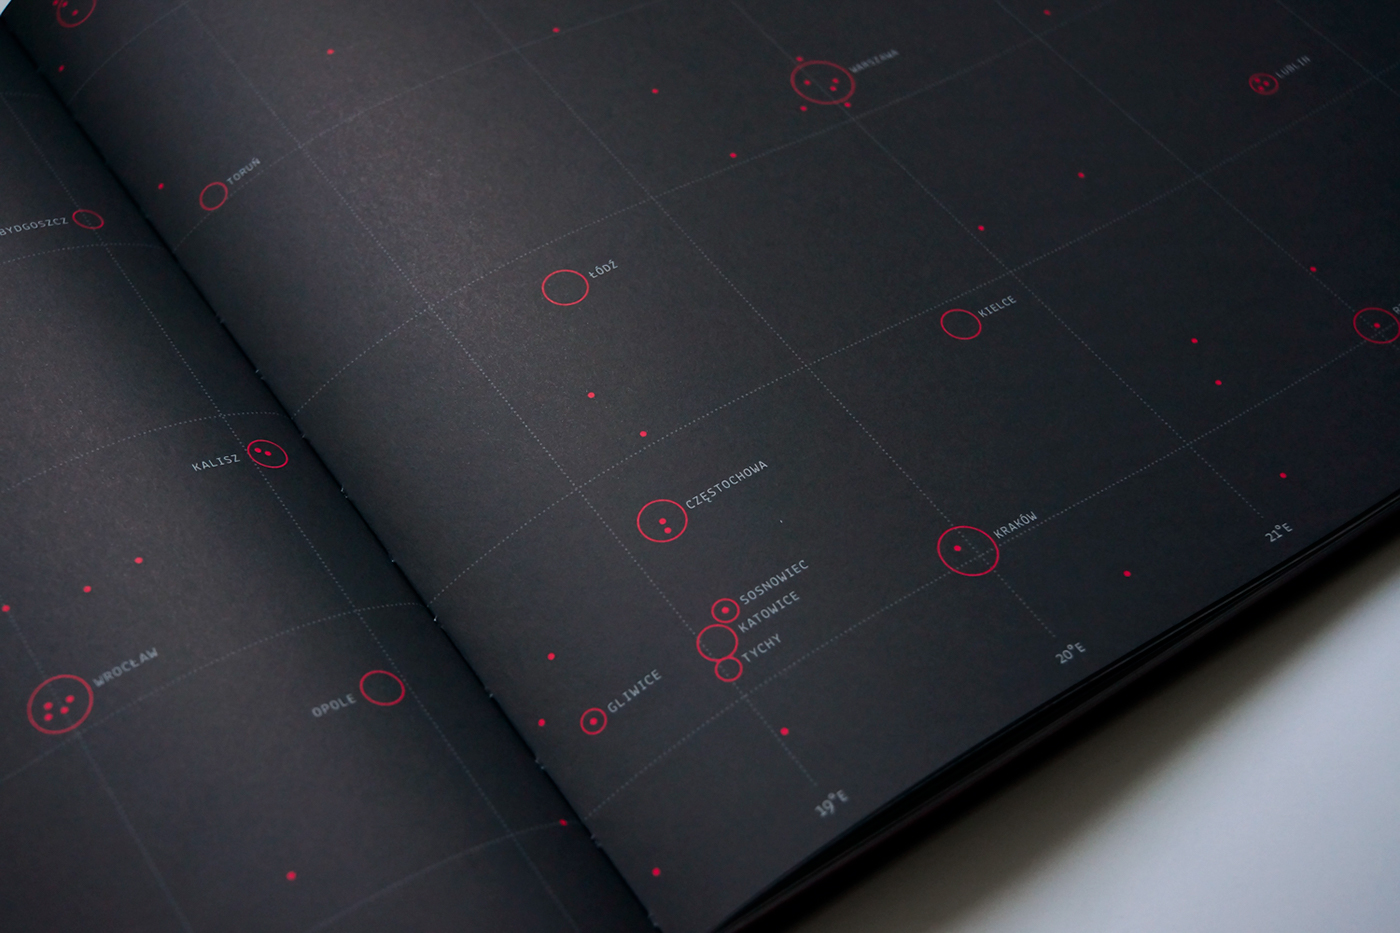
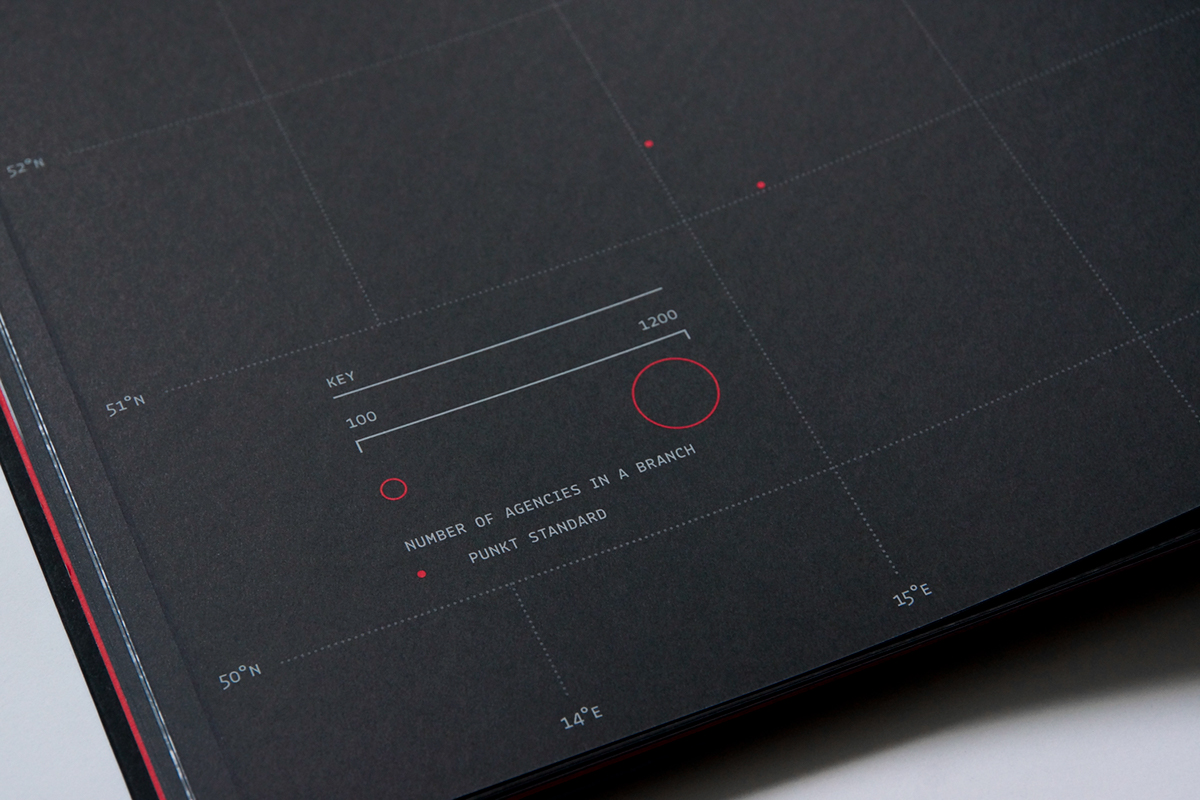
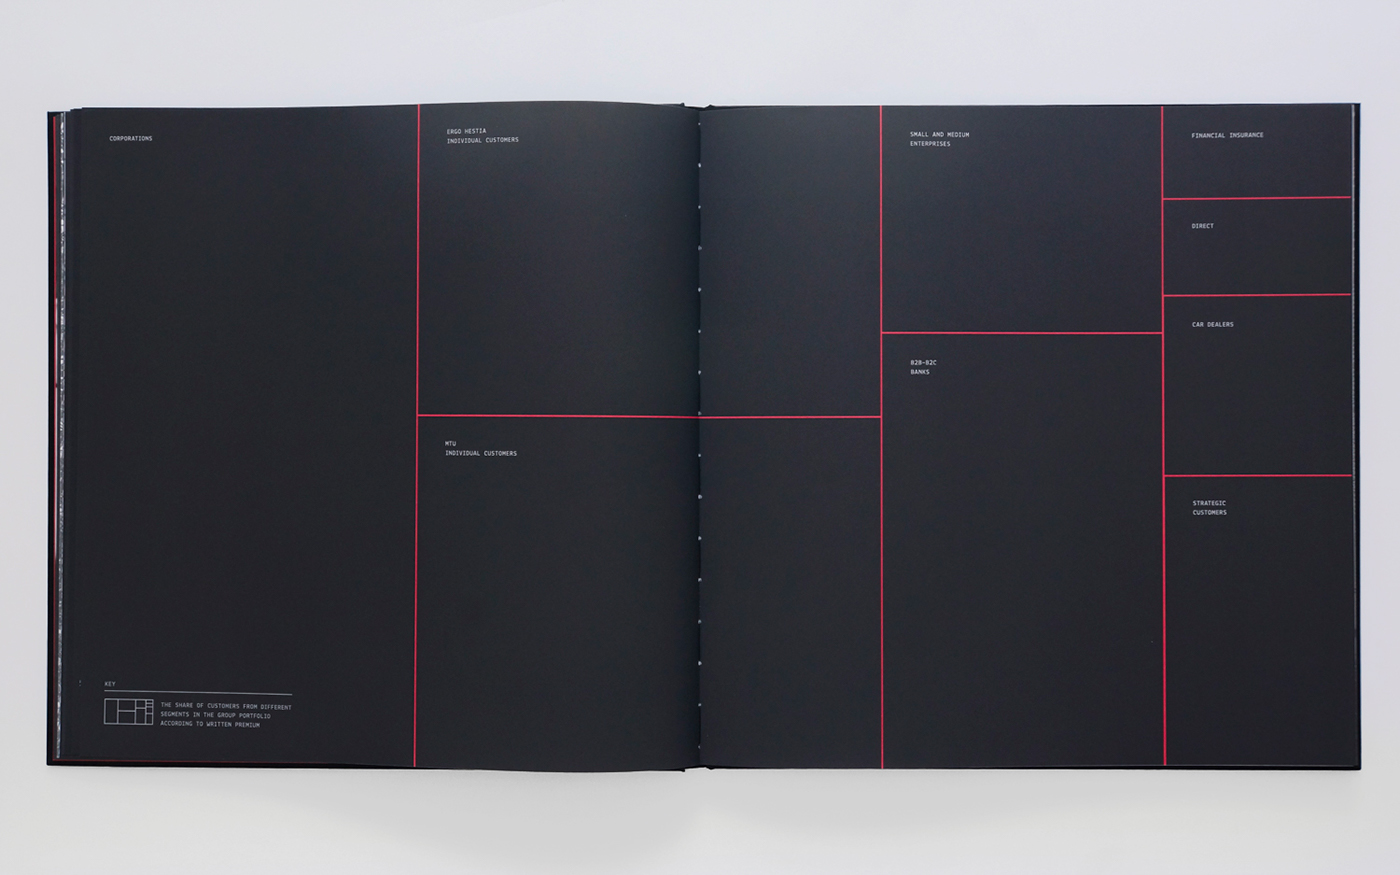
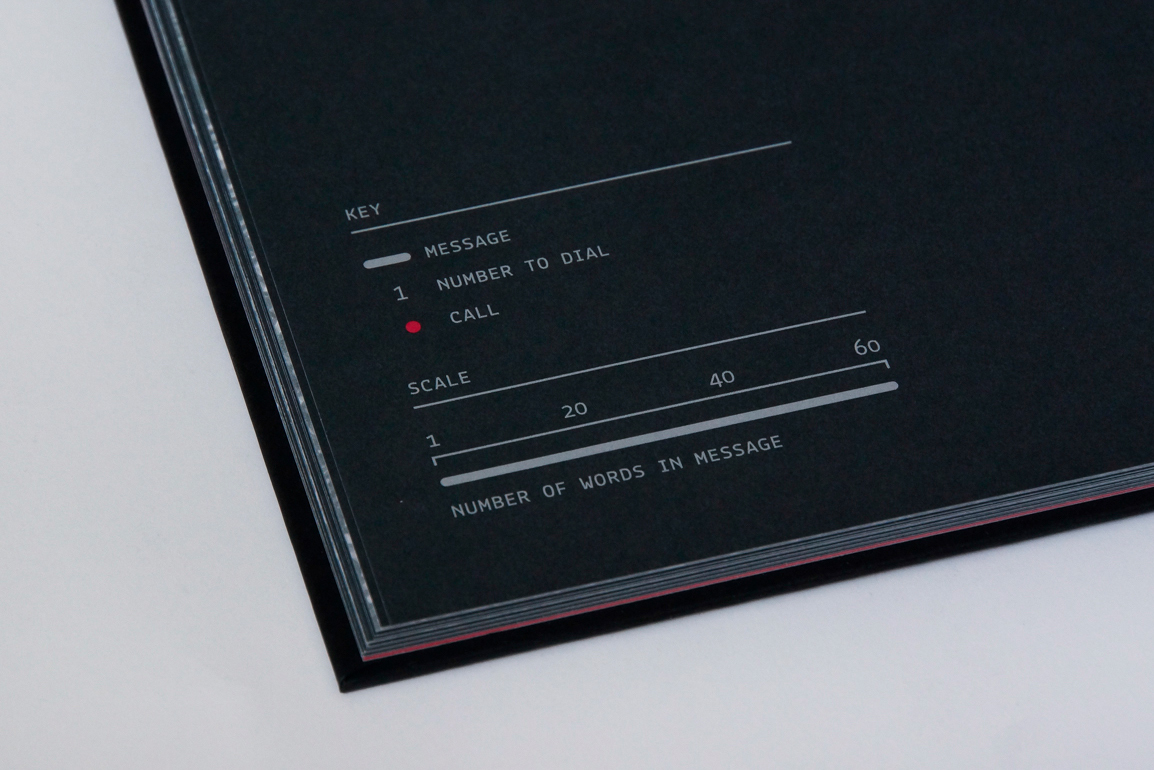
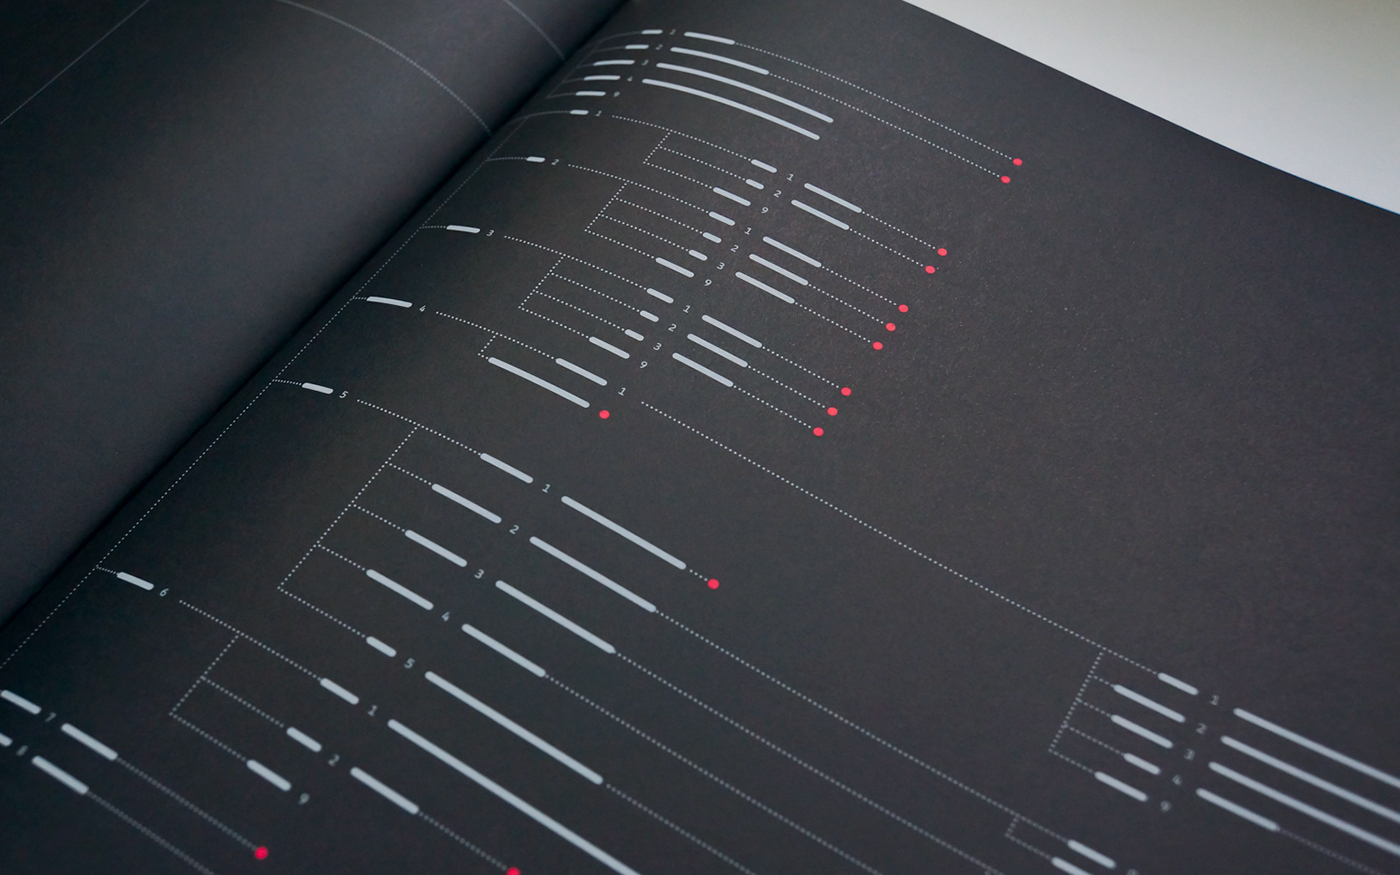
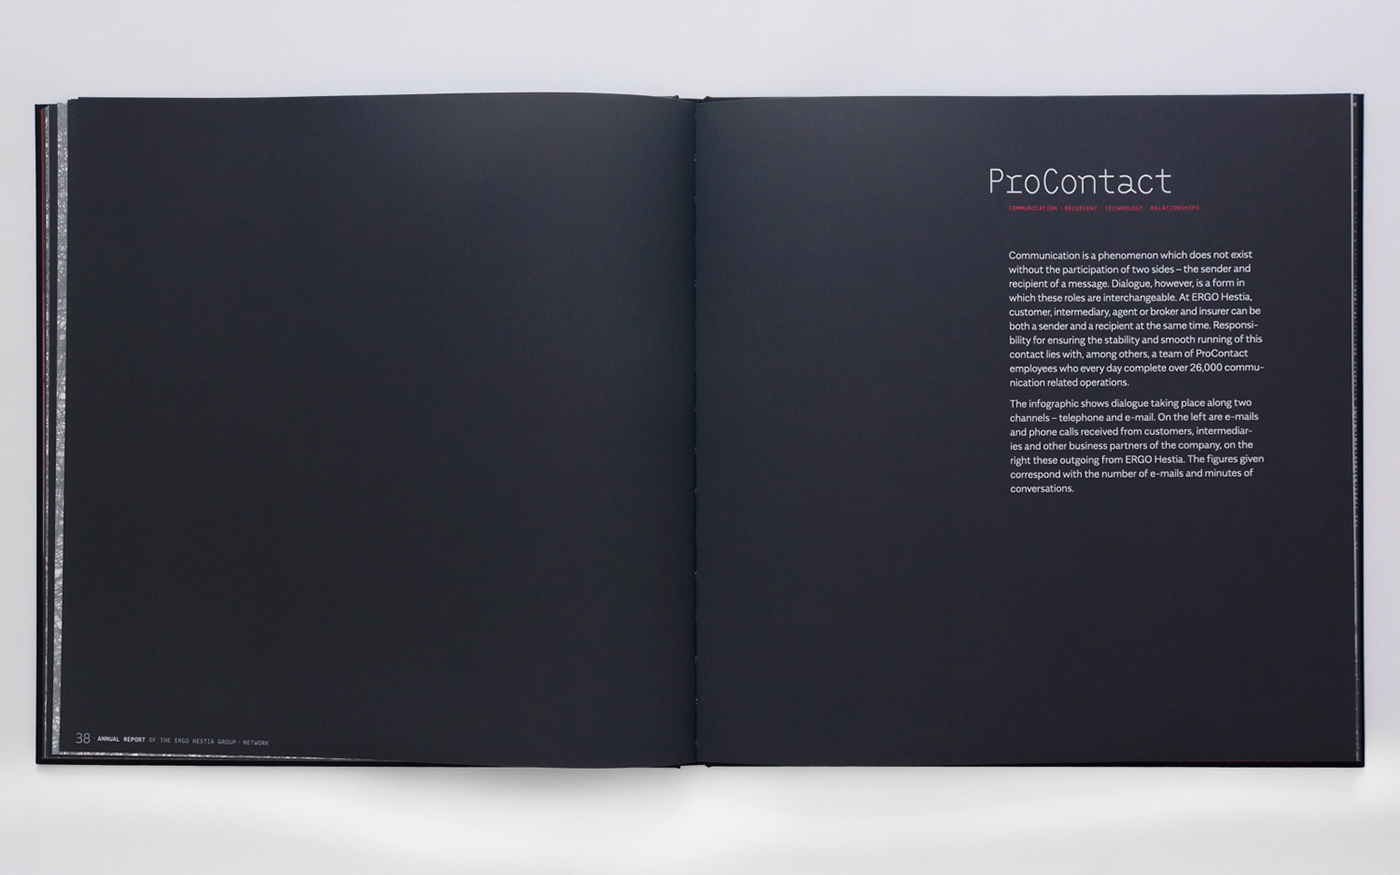
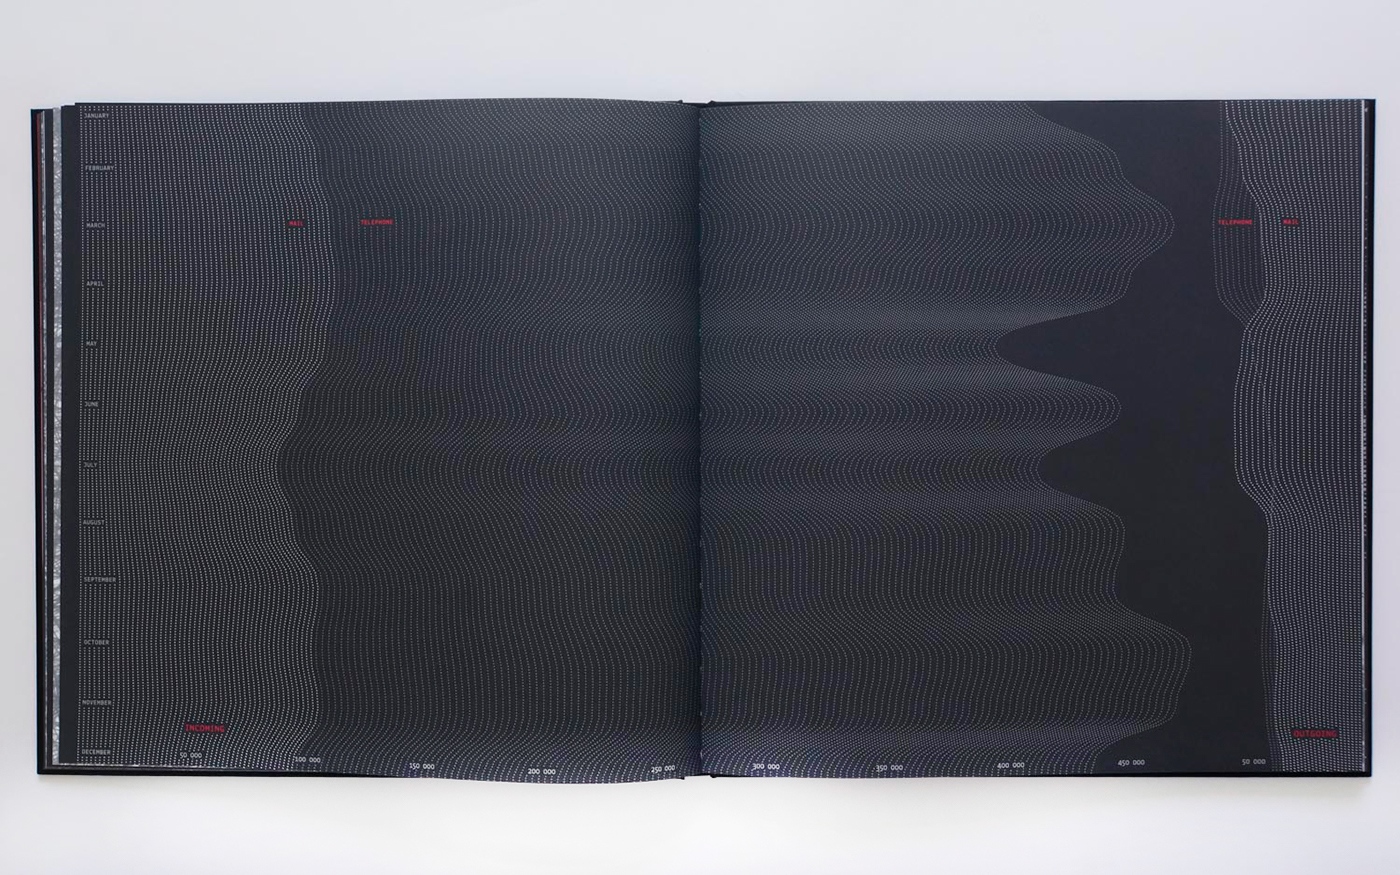
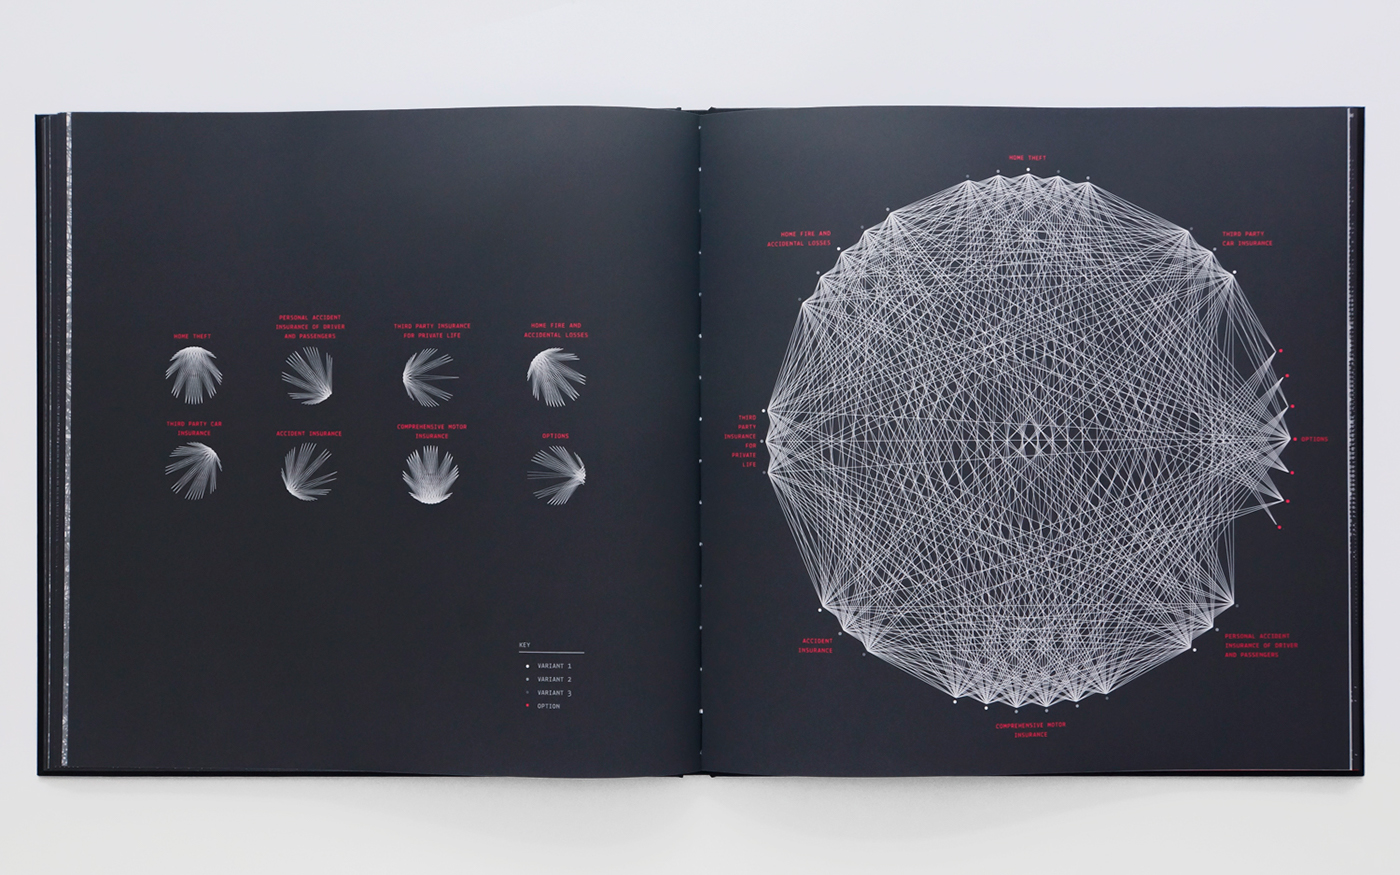
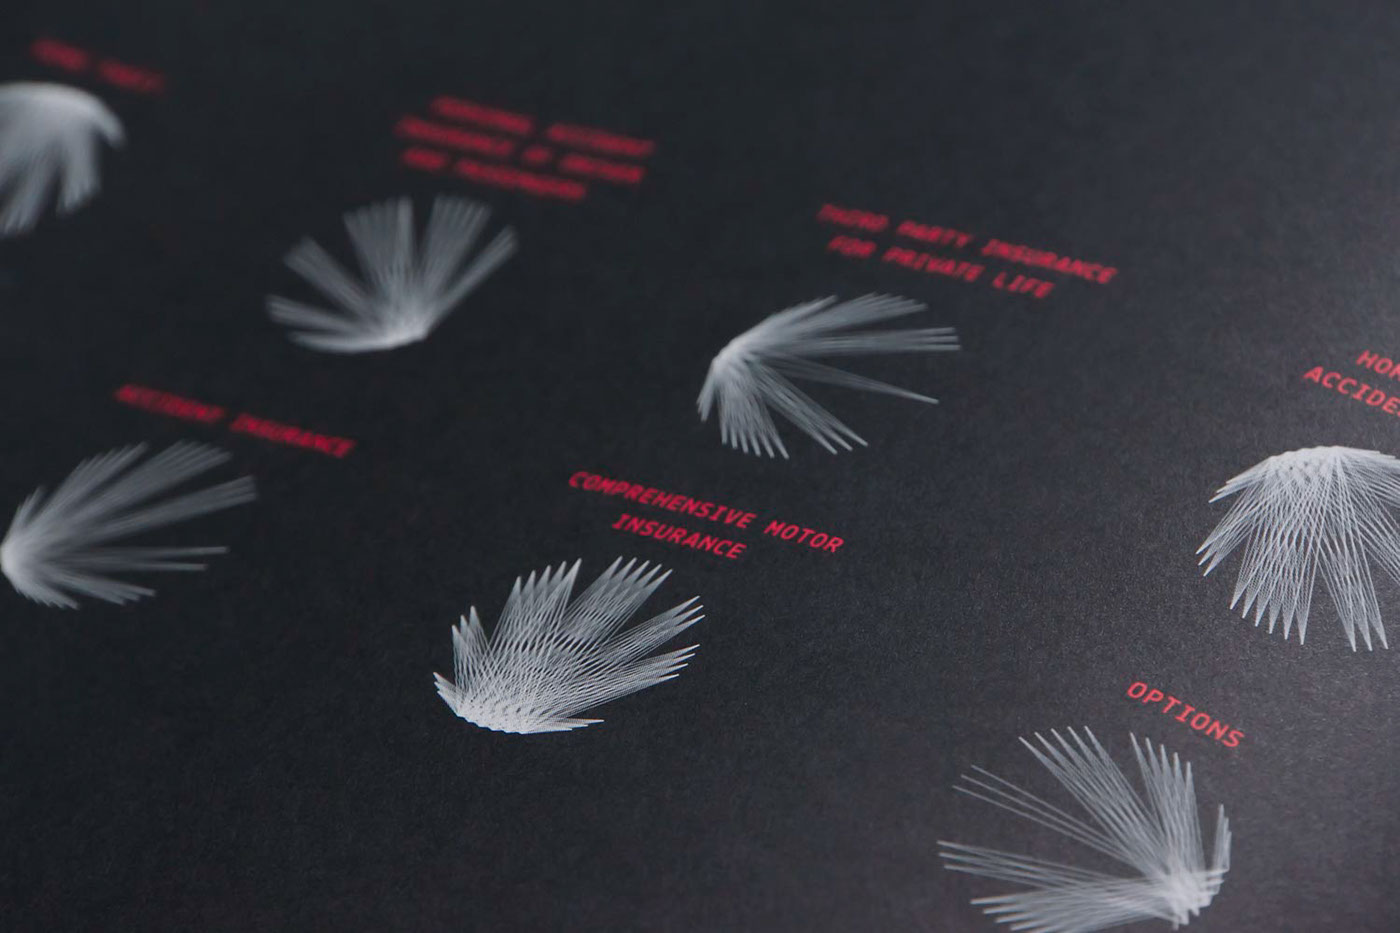
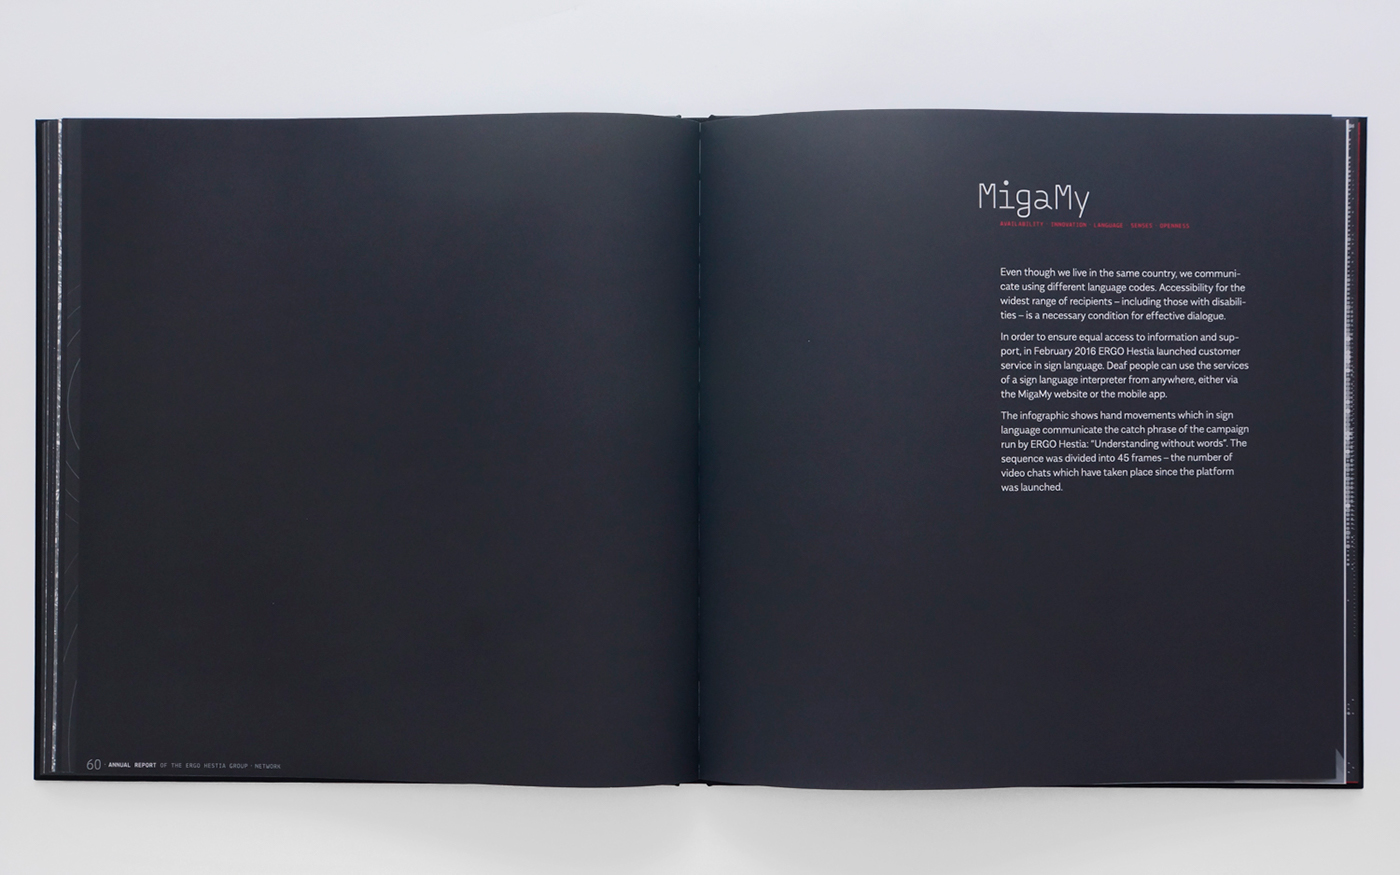
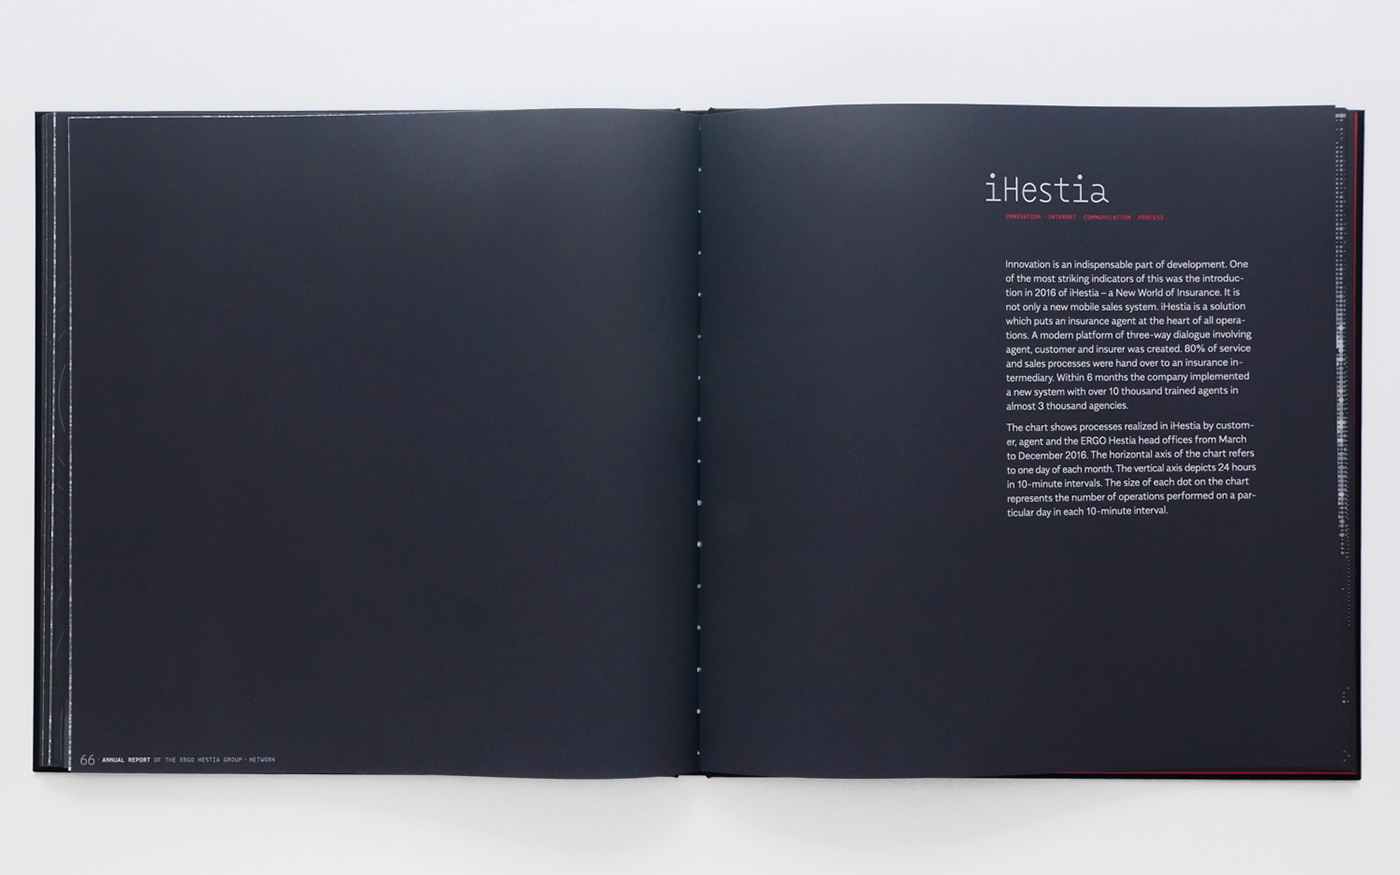
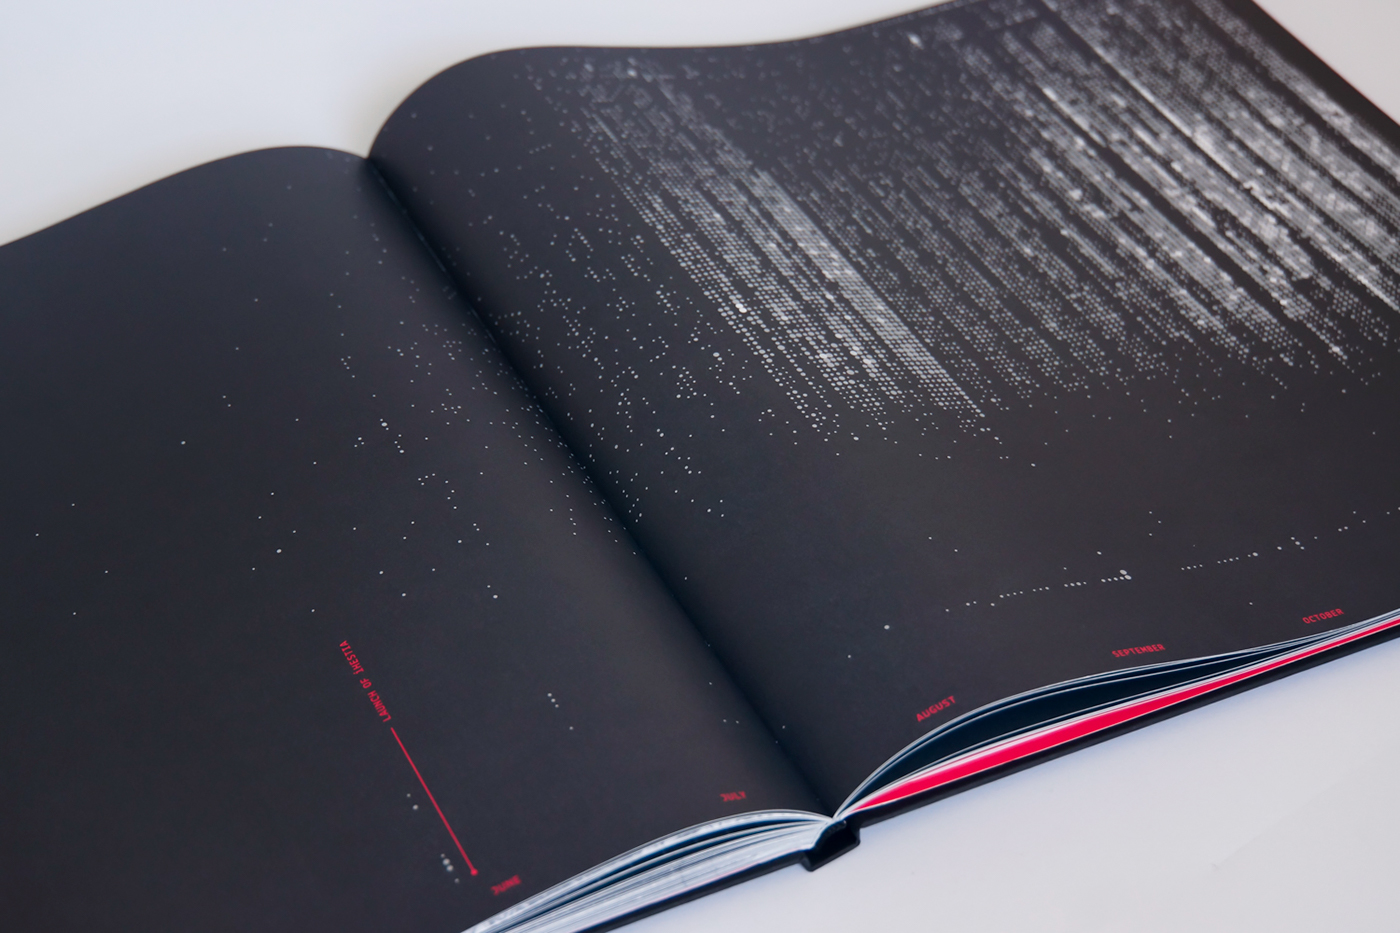
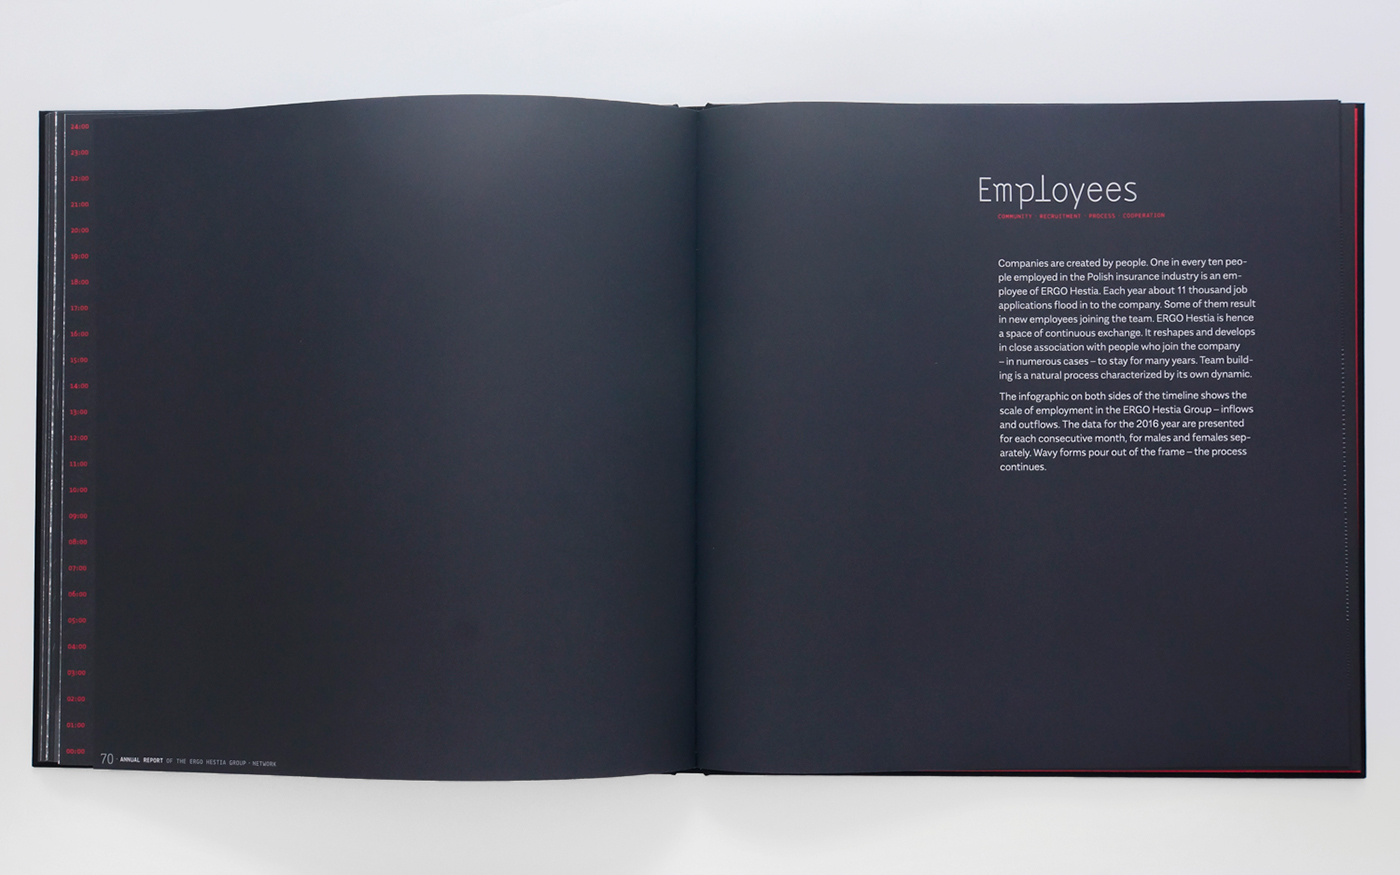
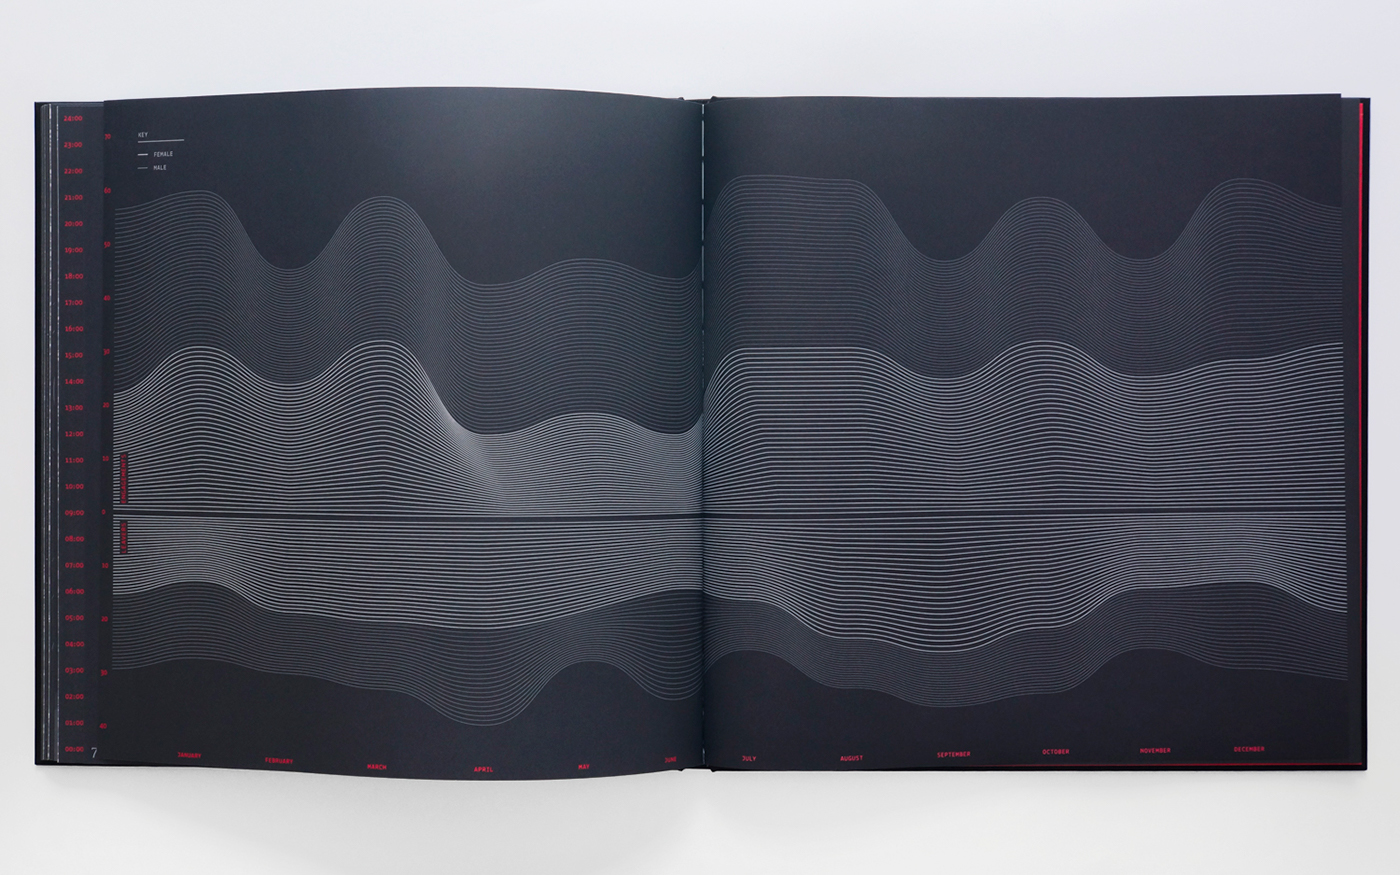
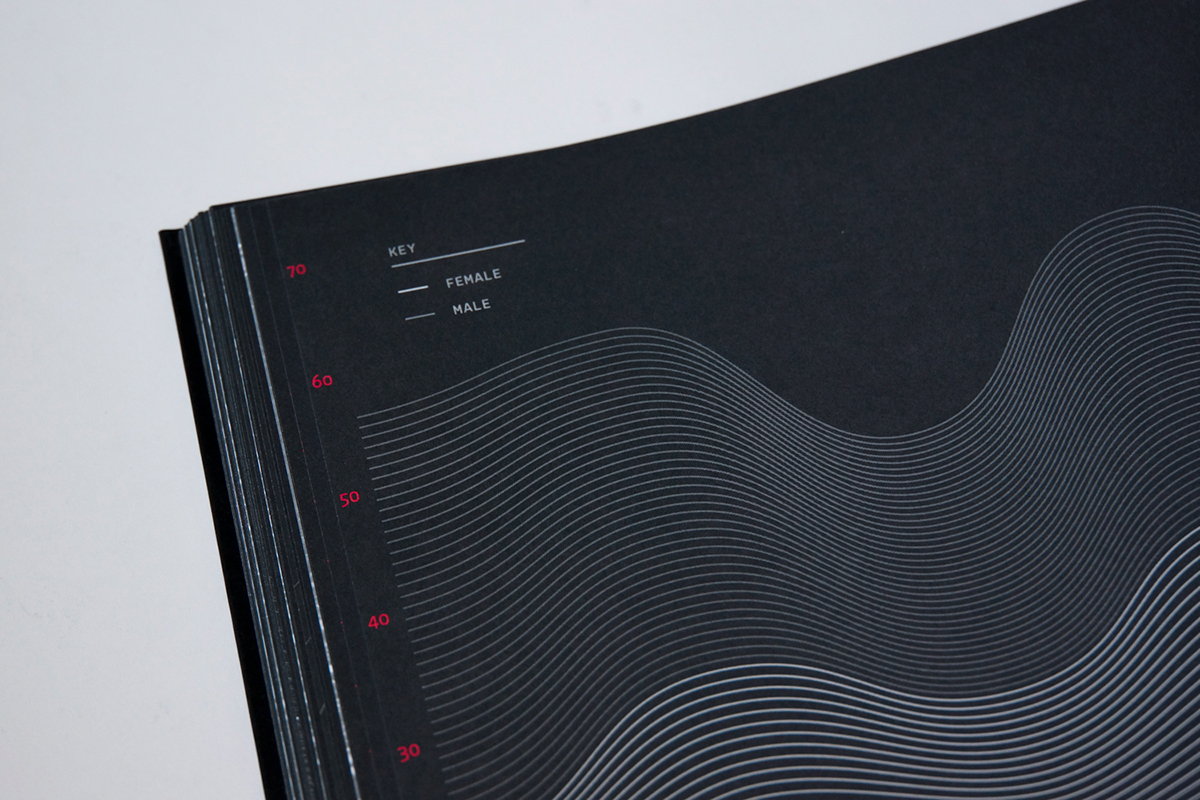
The solution I proposed involves a range of data visualizations, depicting diverse phenomena and processes within the company. The title „Network” determines the subject matter of the infographics and, at the same time, the structure of the publication. Its construction resembles hypertext – the first visualization presents topics to which links can be found on subsequent pages.
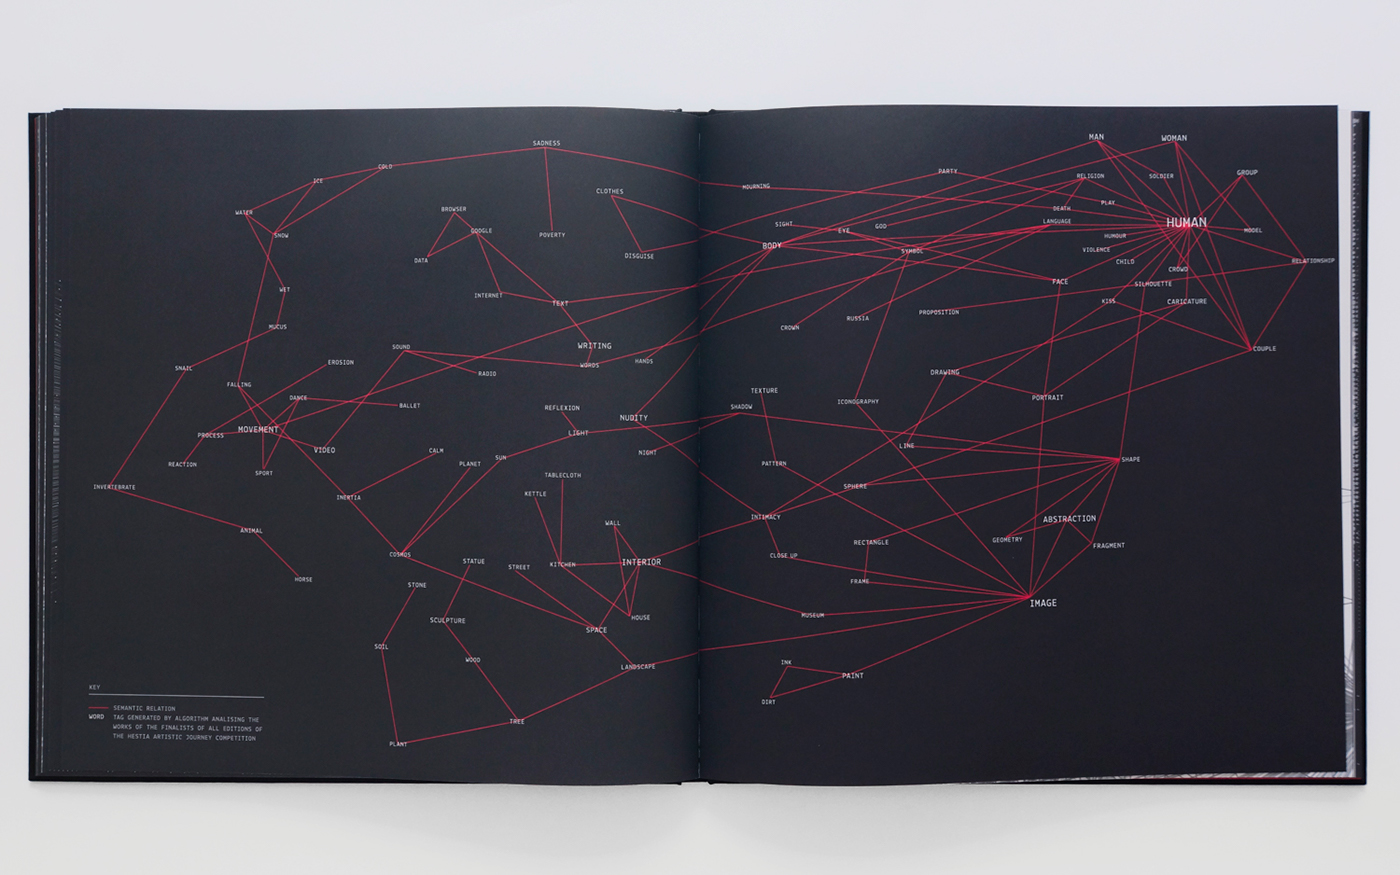
Each of the visualizations is a result of multistage processing of data, mainly through spreadsheets, network and image analysis software, coding and finally graphic design.
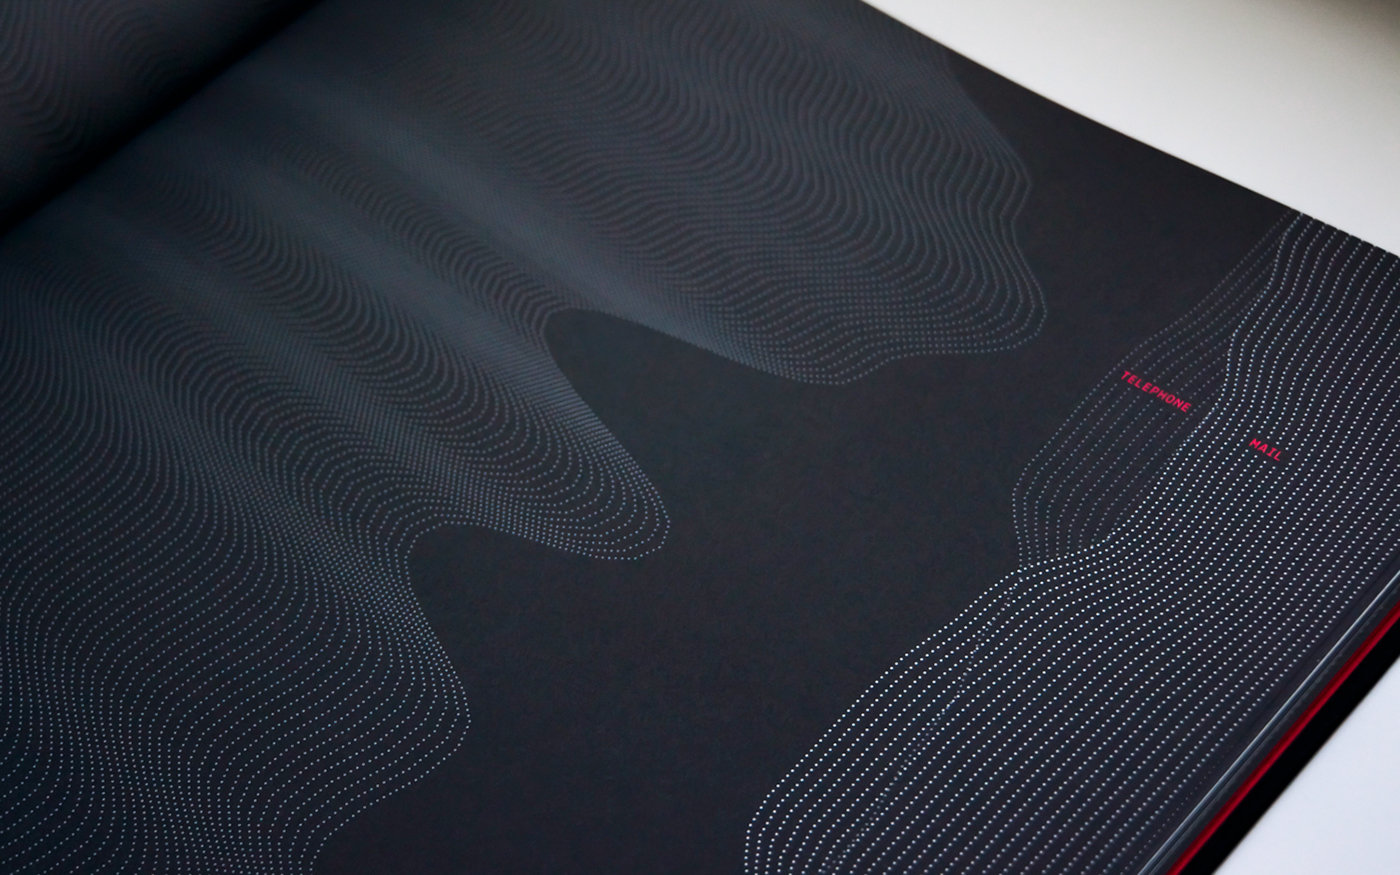
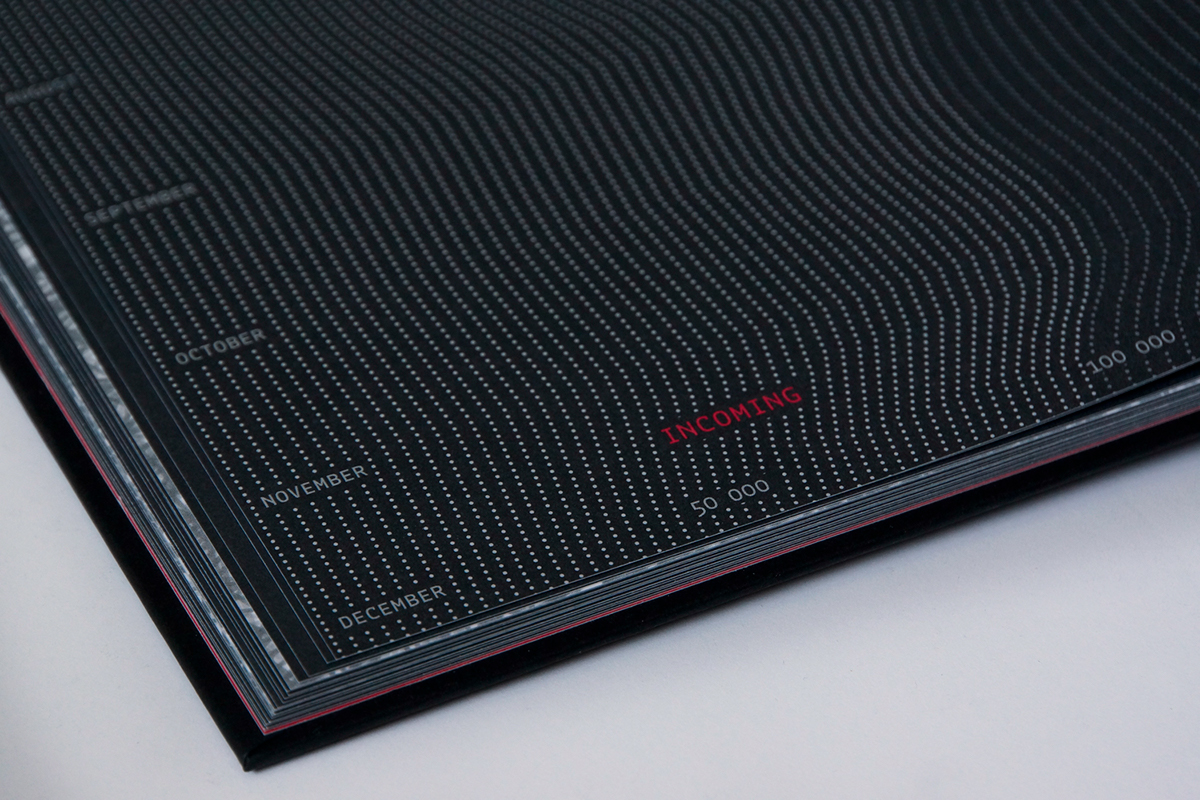
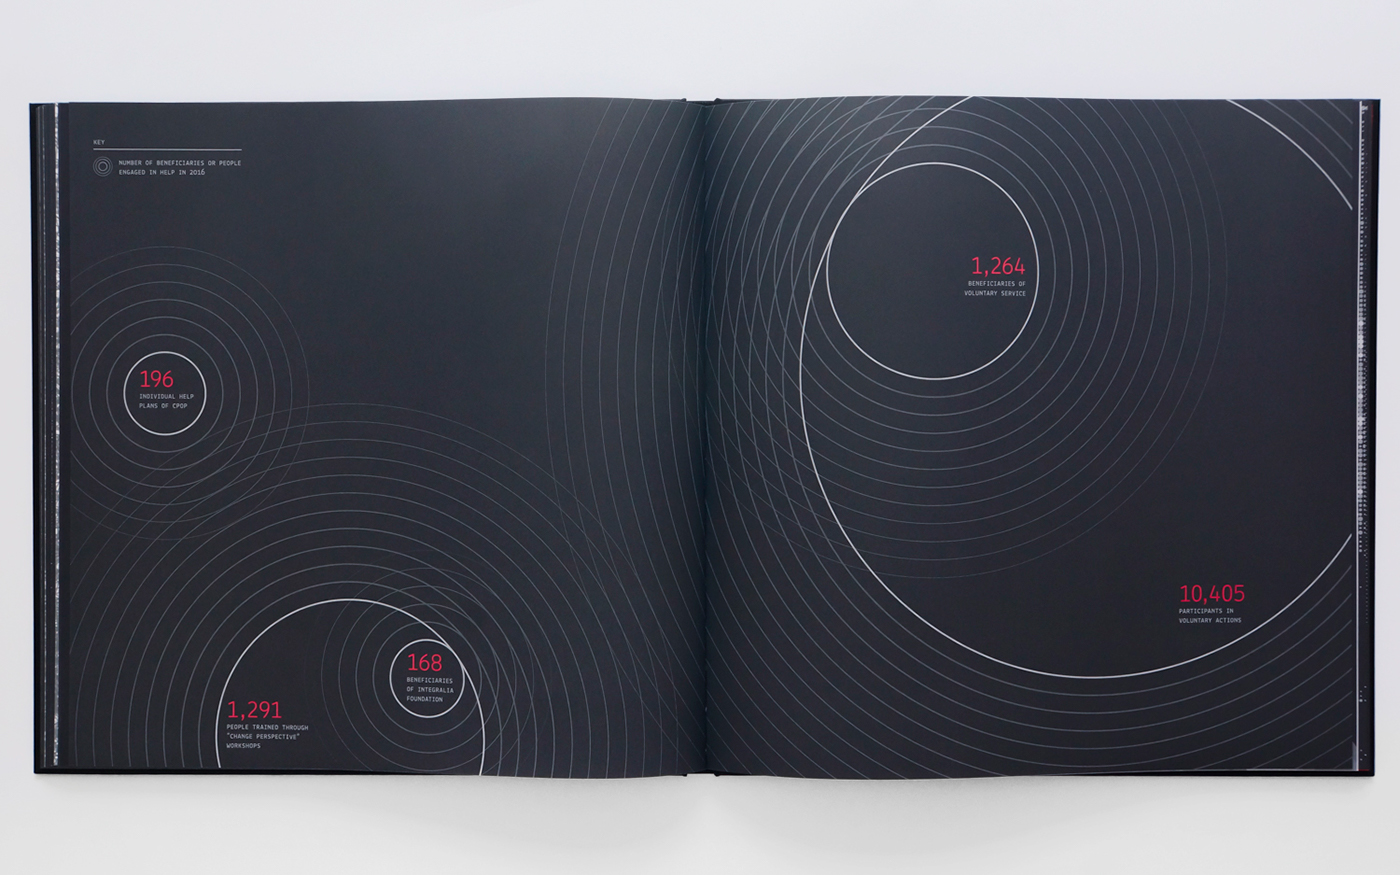
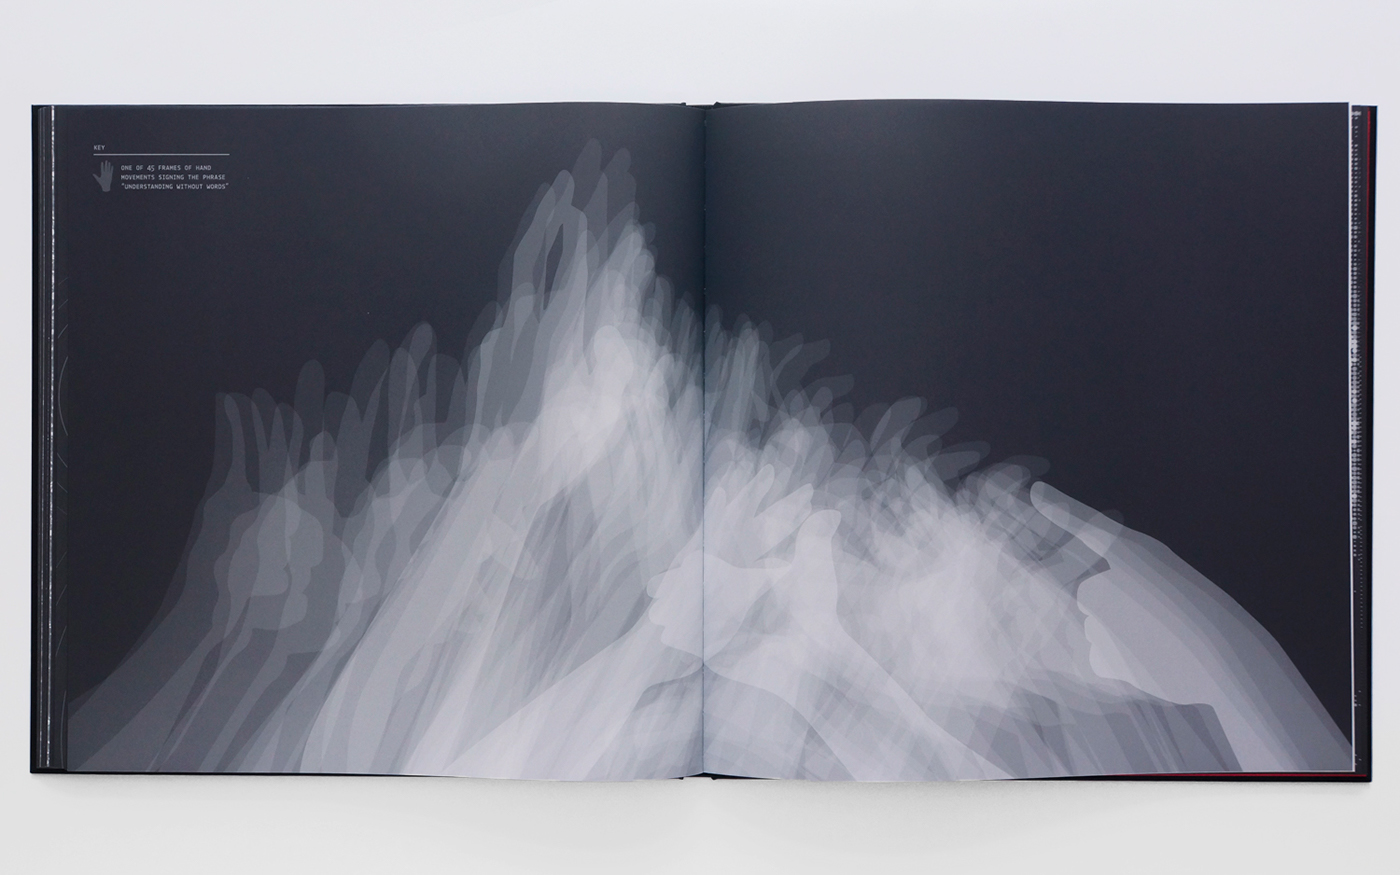
My aim was to visualize and materialize abstract numbers and phenomena, giving a tangible shape to them. All visualizations have their source in large quantities of statistical data. At the same time each of them is an independent picture which can function without informative context.
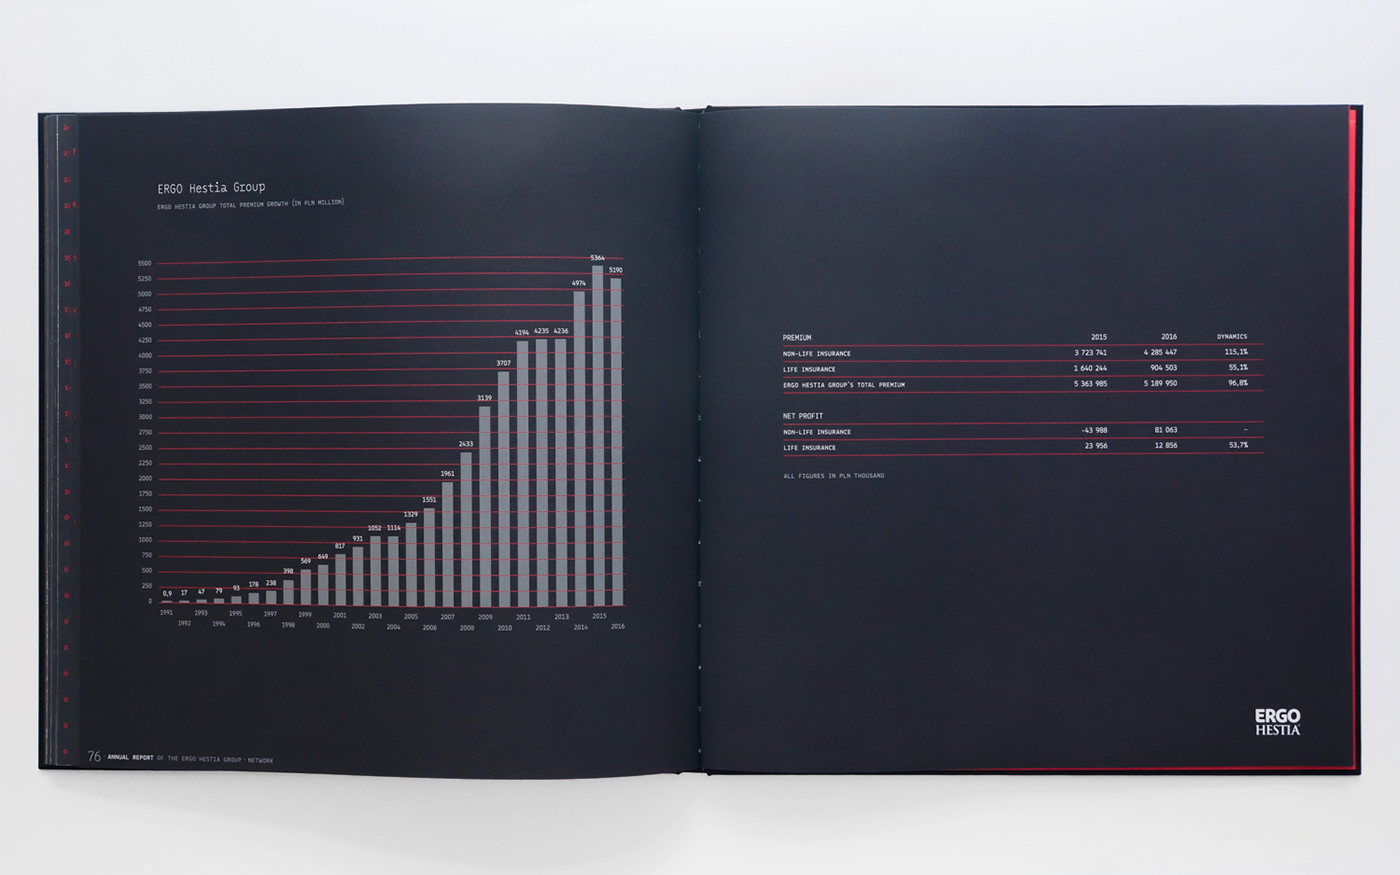
As such, the Report evolved into a complex project, in the framework of which I was responsible for every part of its creation: the concept, interviews, research, analysis and processing of data, publication design, creating infographics, copyright and typesetting of two language versions.
Format: 30x30 cm
Number of pages: 84
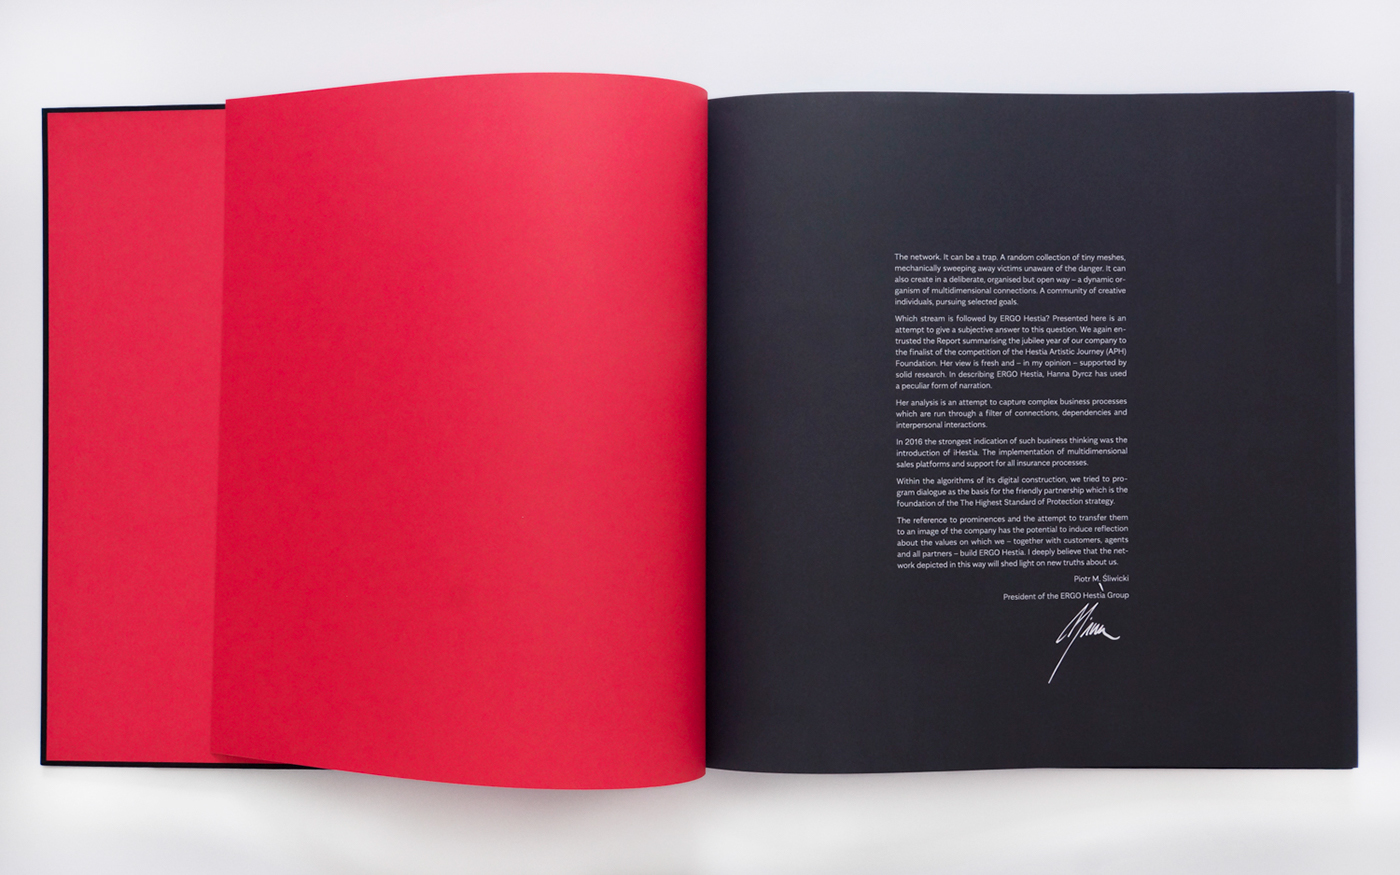
Printed with 3 Pantone colors on Pergraphica Smooth Classic 150g
Hard cover with silver hot stamping
You can see the digital version here

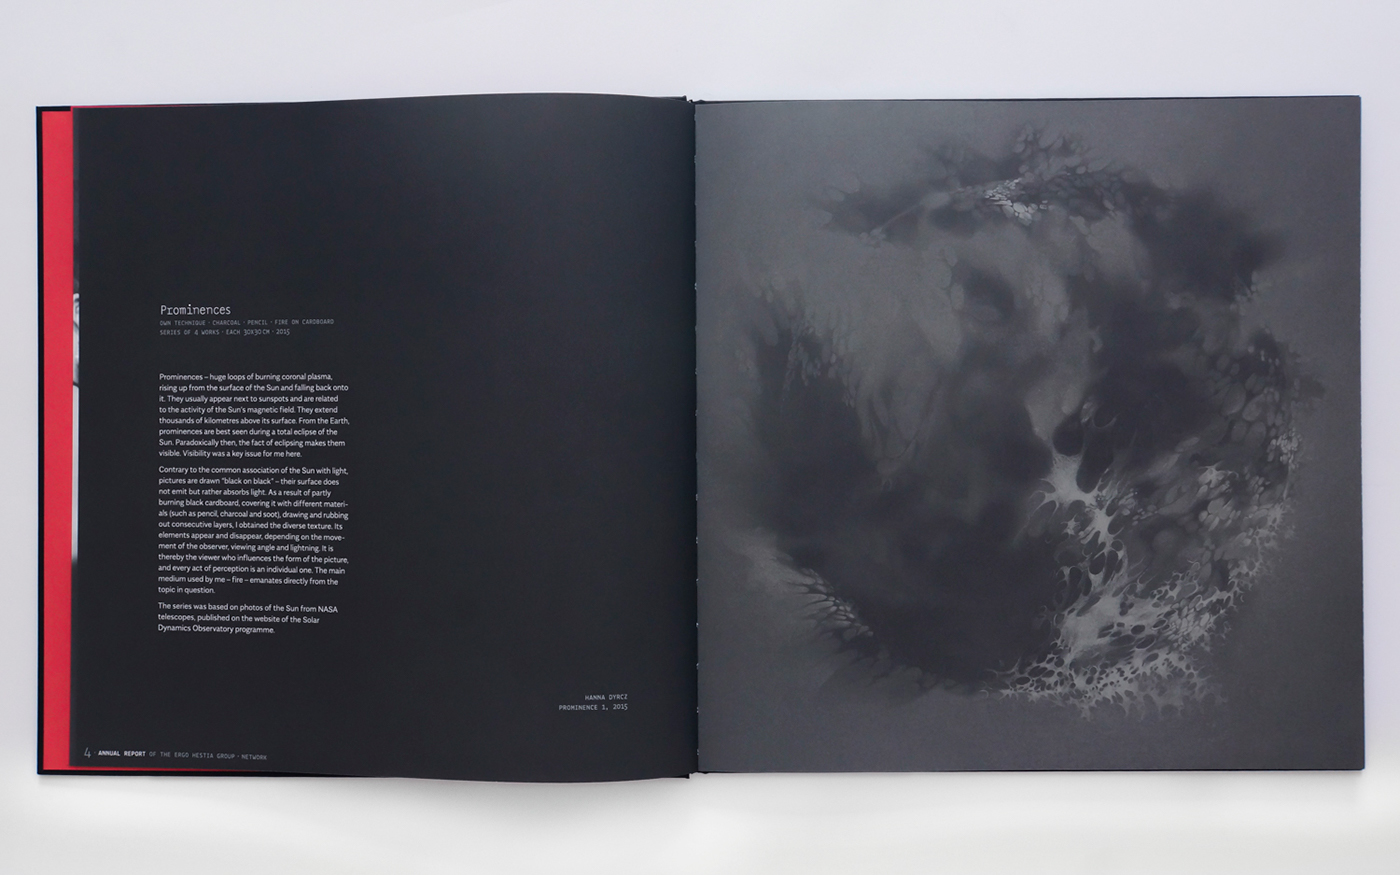
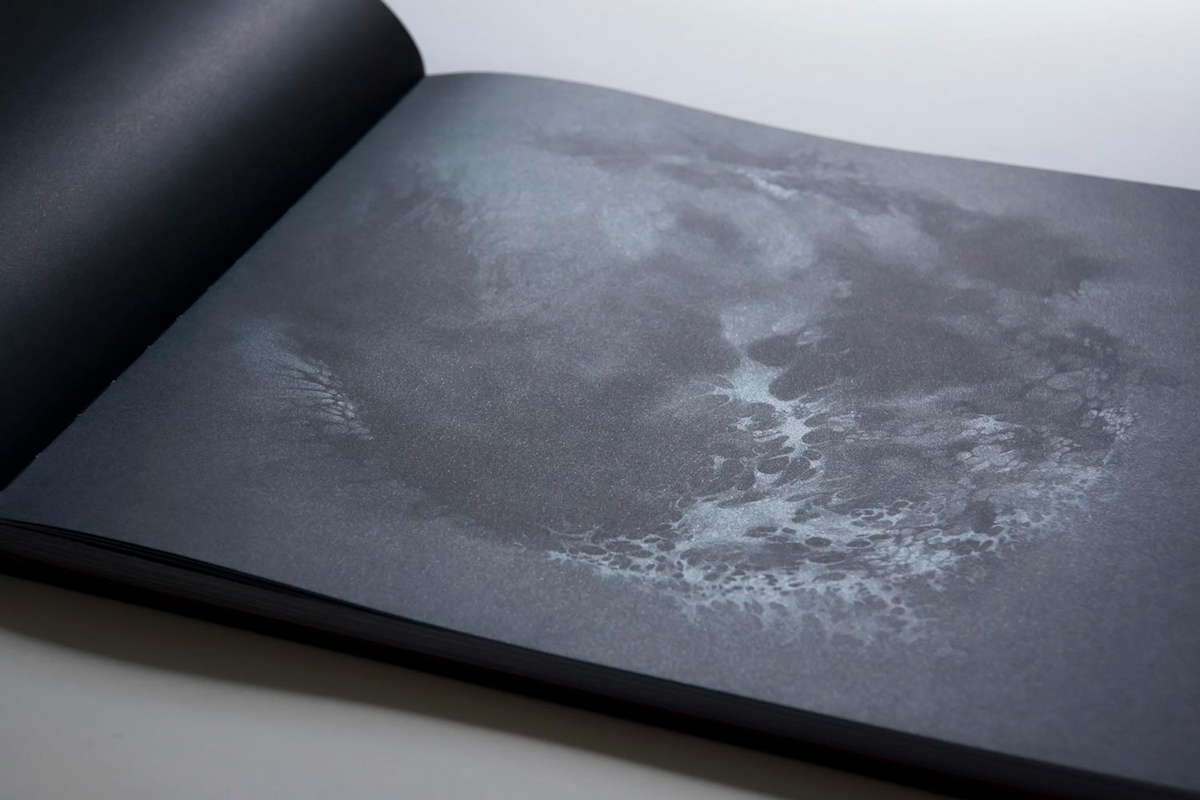
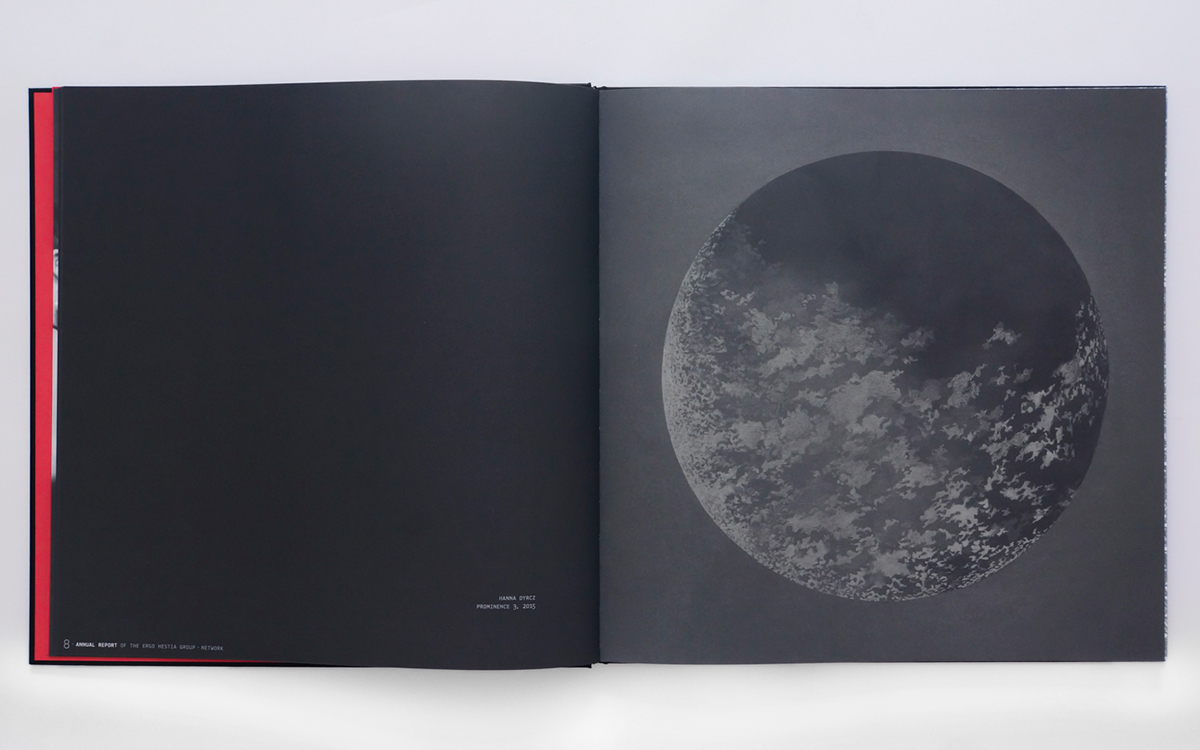
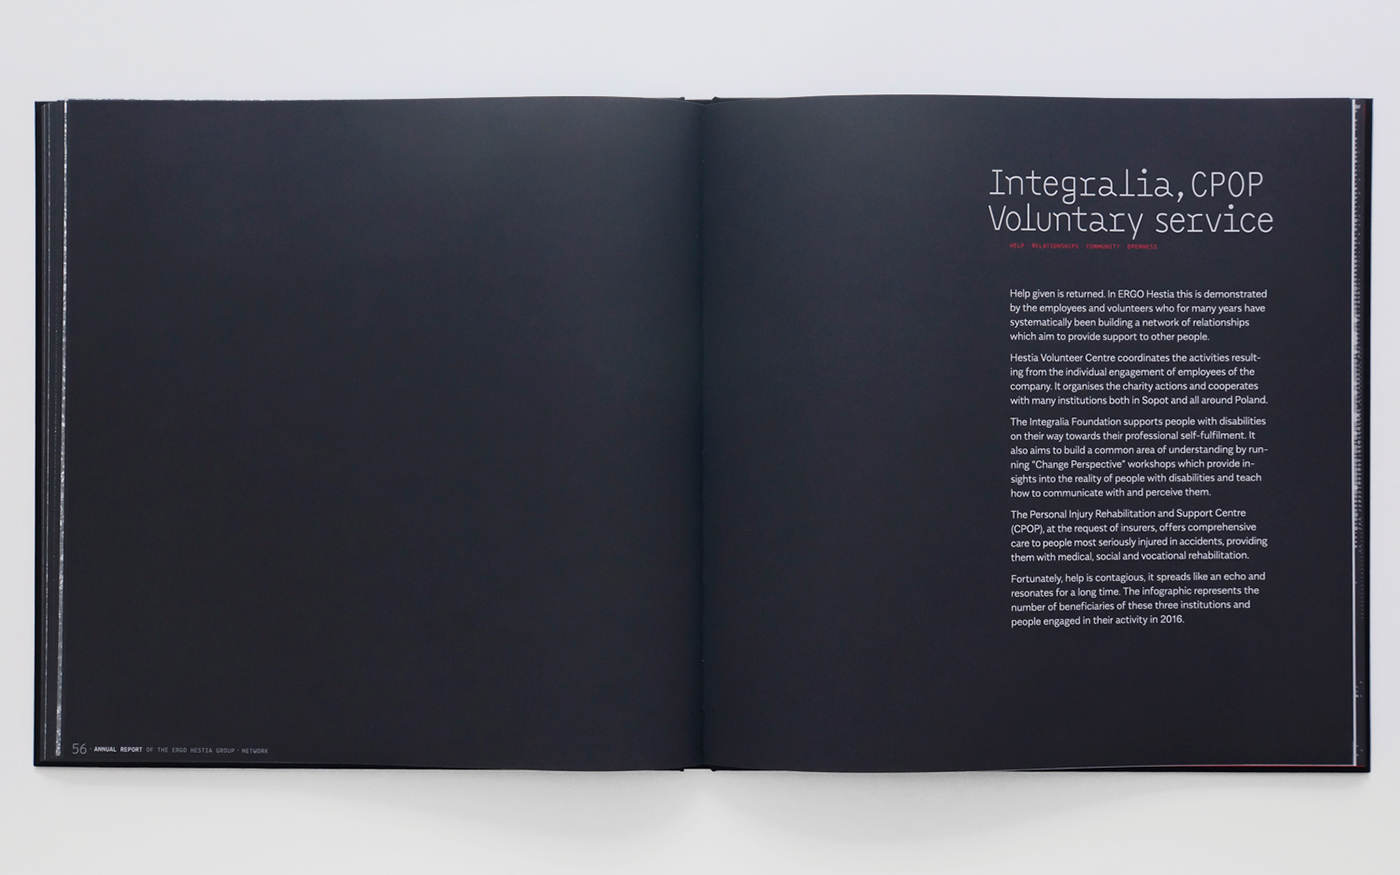
The Report begins with the presentation of my drawings awarded in the Hestia Artistic Journey Contest. The original drawings were created using pencil and fire in the way that their shape appears and disappears depending on the viewing angle. To reproduce them as faithfully as possible, I decided to print them with silver Pantone on black so that they can behave like the original ones.

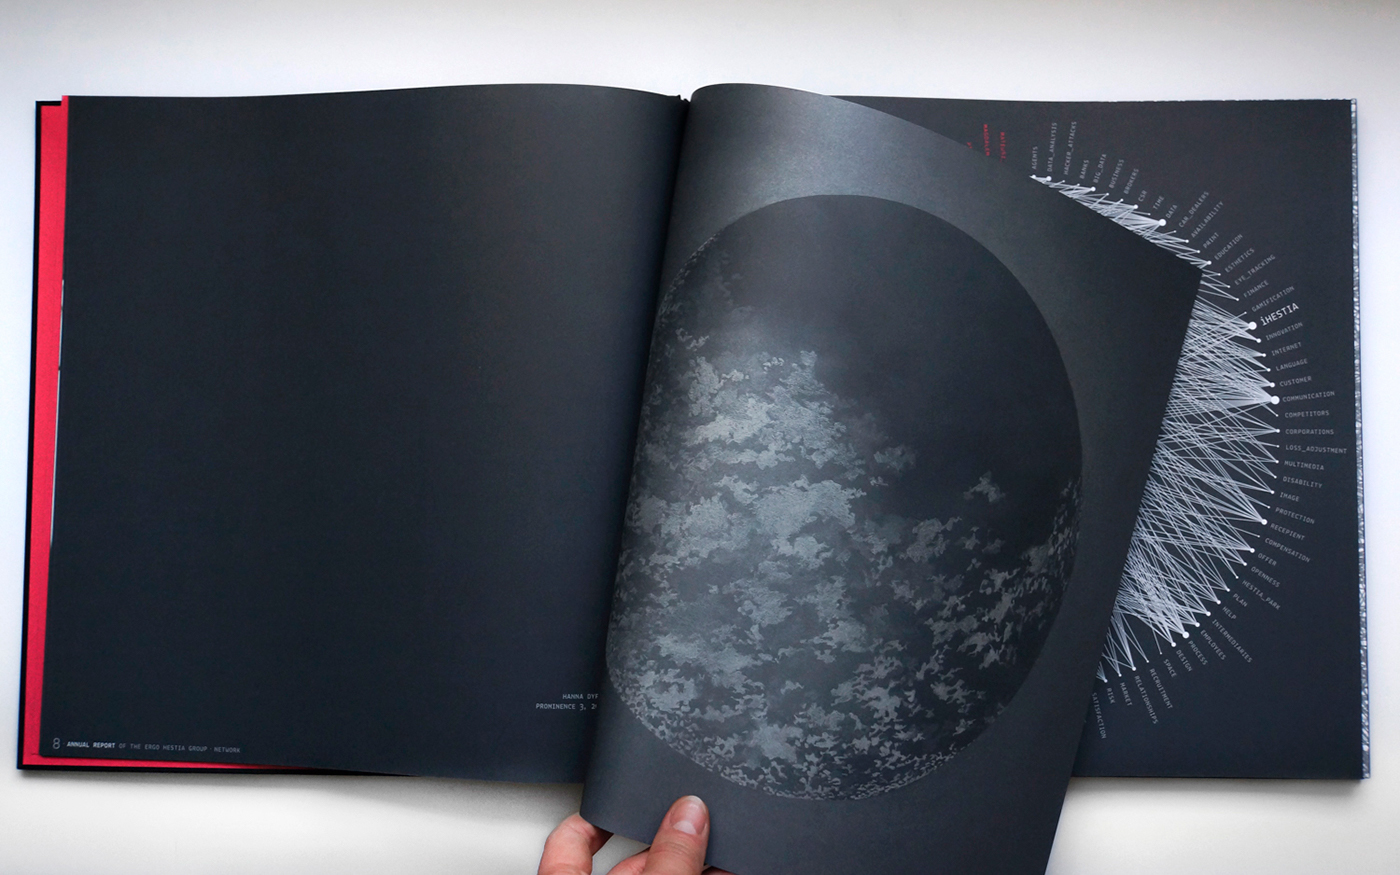
The first visualization is constructed with data I gathered during over 60 hours of meetings with ERGO Hestia employees. I recorded each meeting as a cloud of threads which materialized during conversations. By matching topics and people, a network of connections emerged which is also a starting point for the Report.
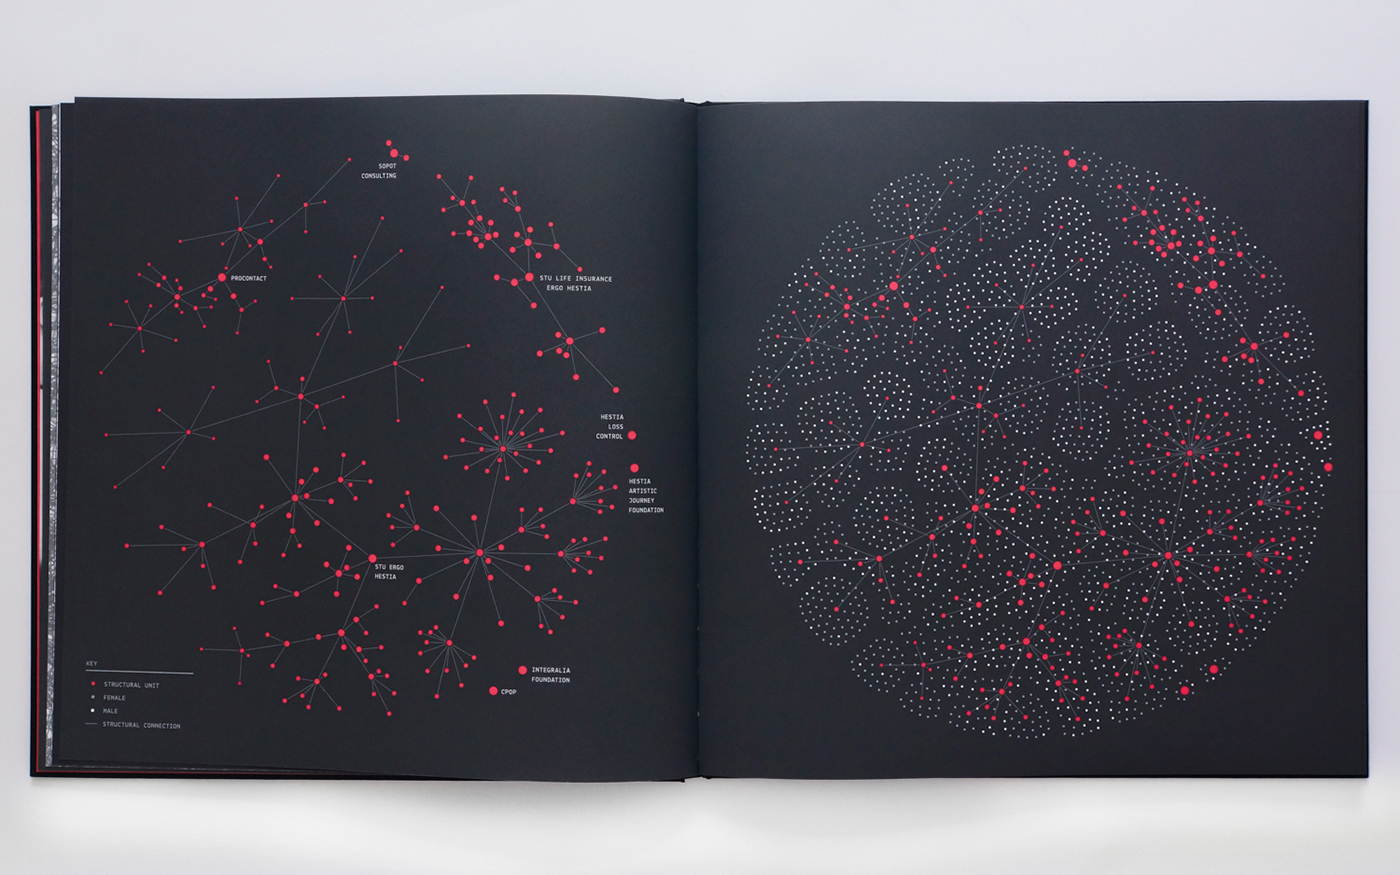
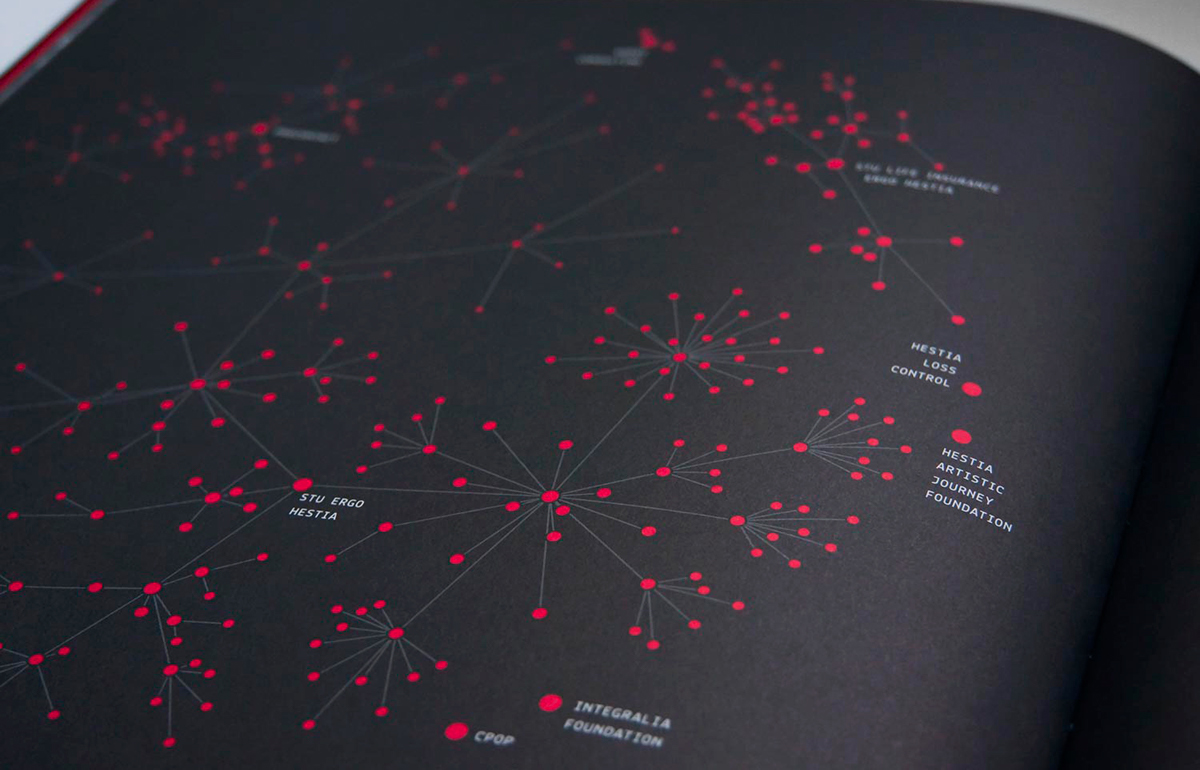

You can find more details about the Company infographic here.
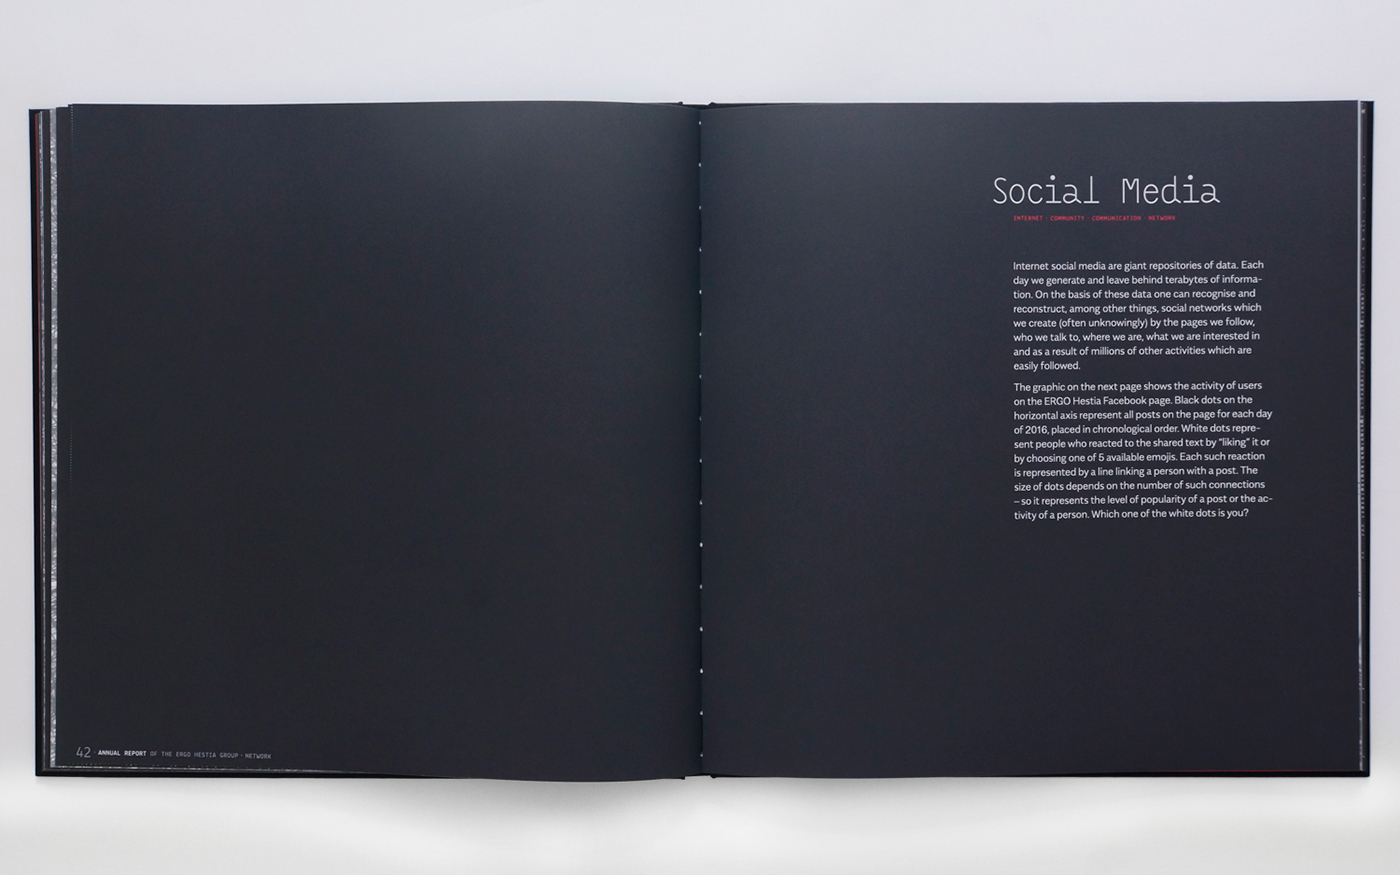
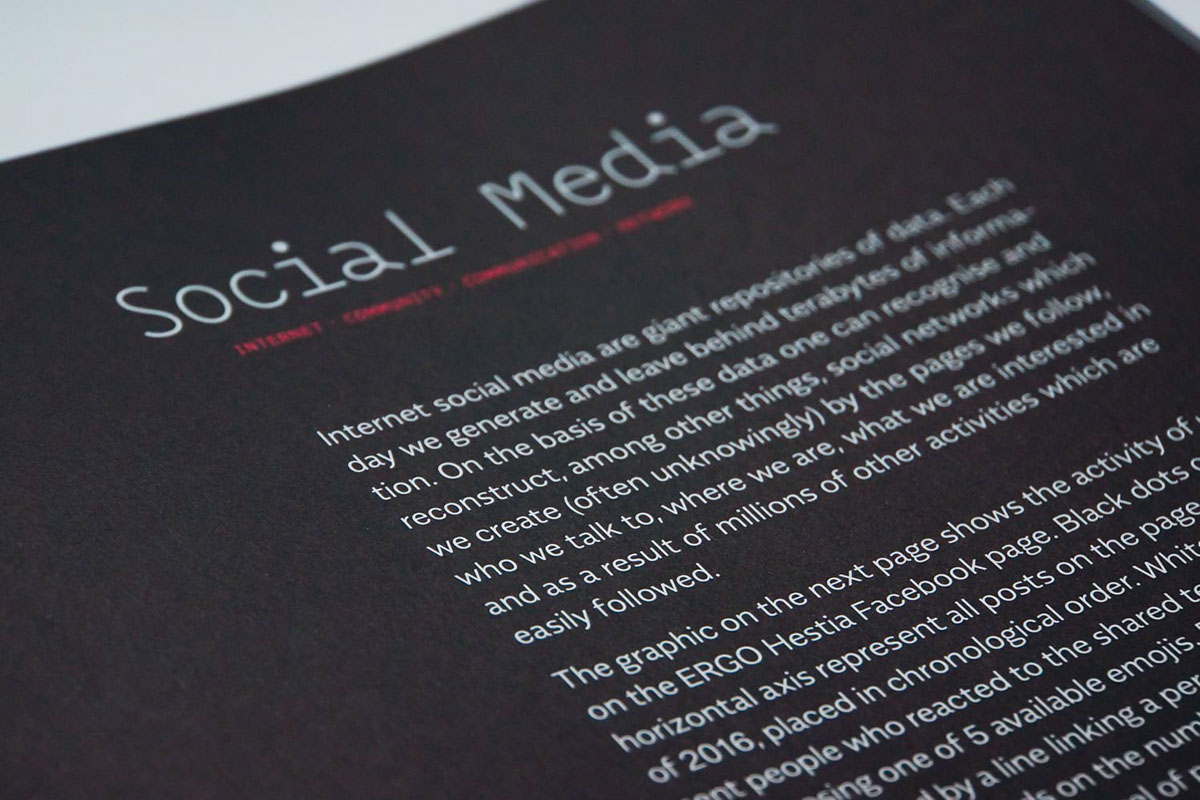
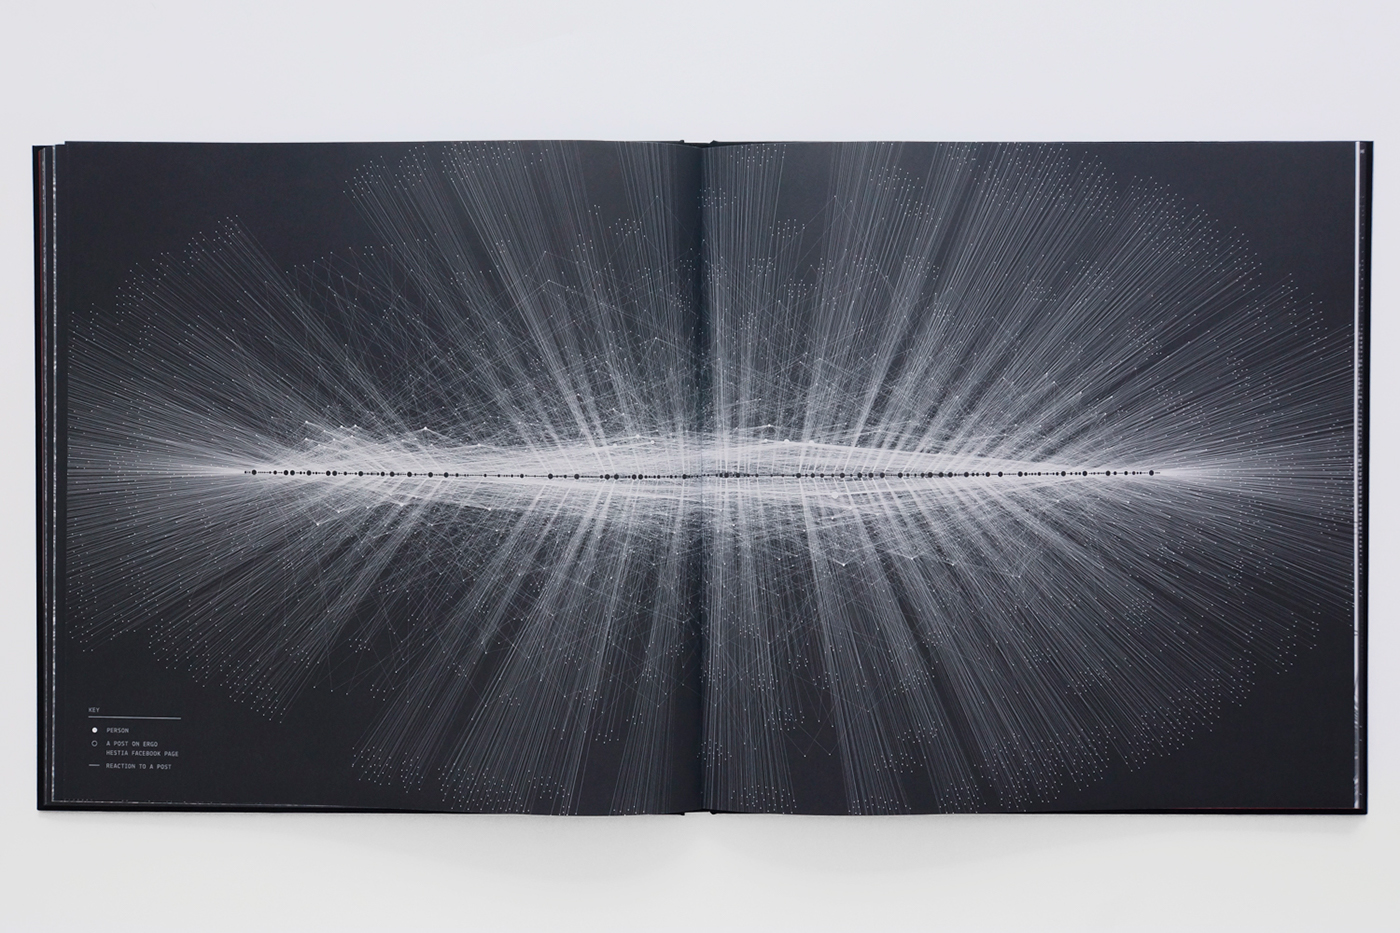
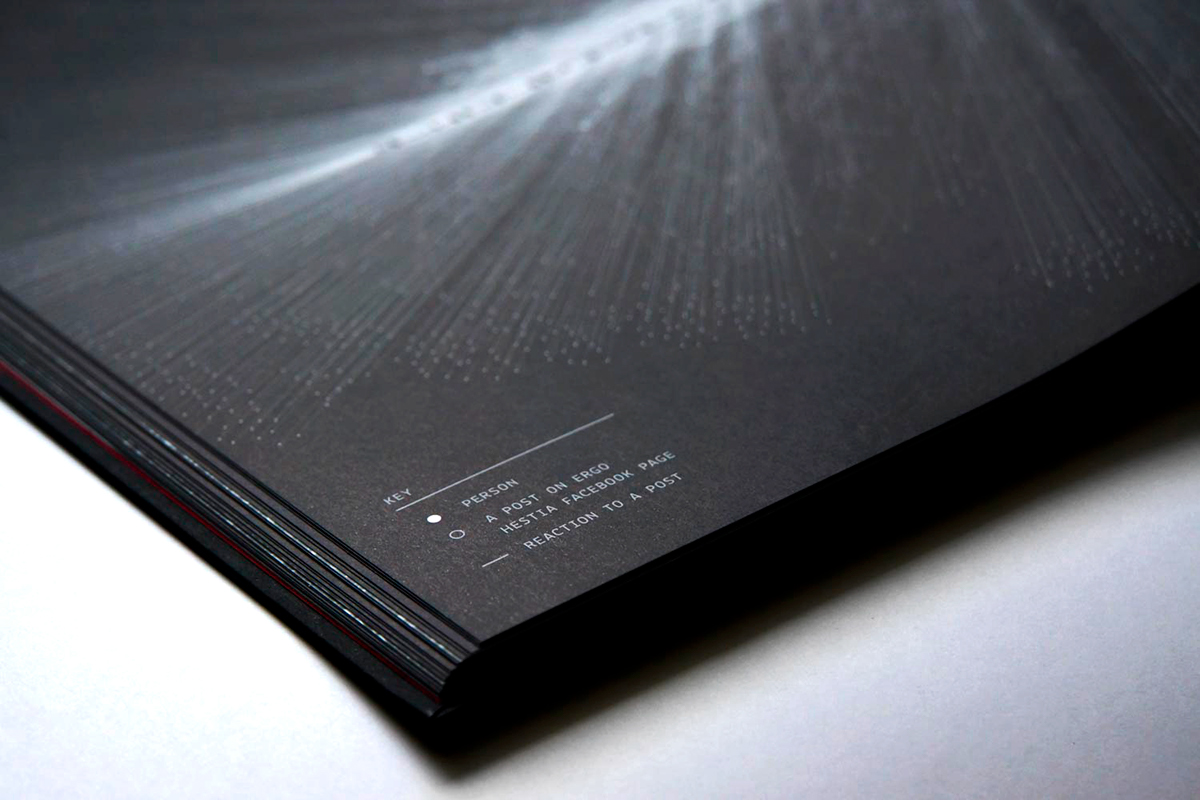
You can find more details about the Social Media infographic here.

The report was published in 2 language versions: English and Polish.
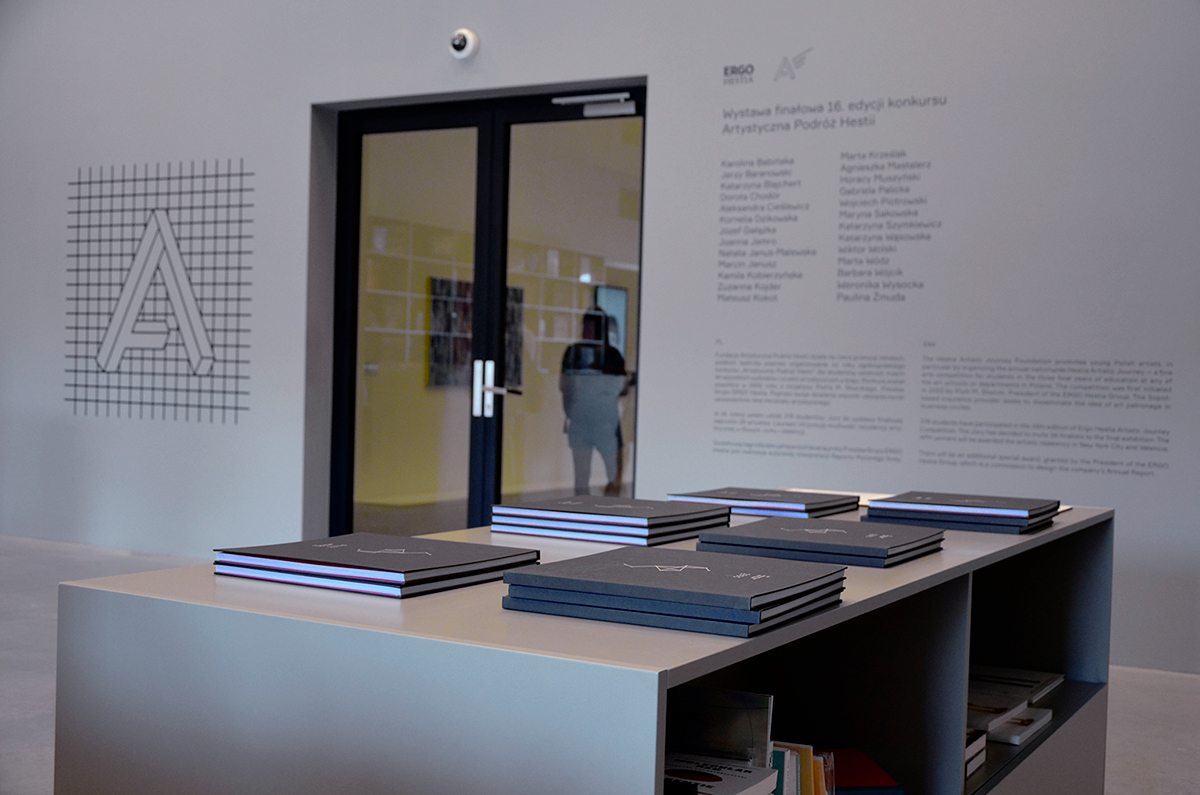
The books were displayed at the Museum of Modern Art in Warsaw, along with lightboxes presenting 3 visualizations from the Report.
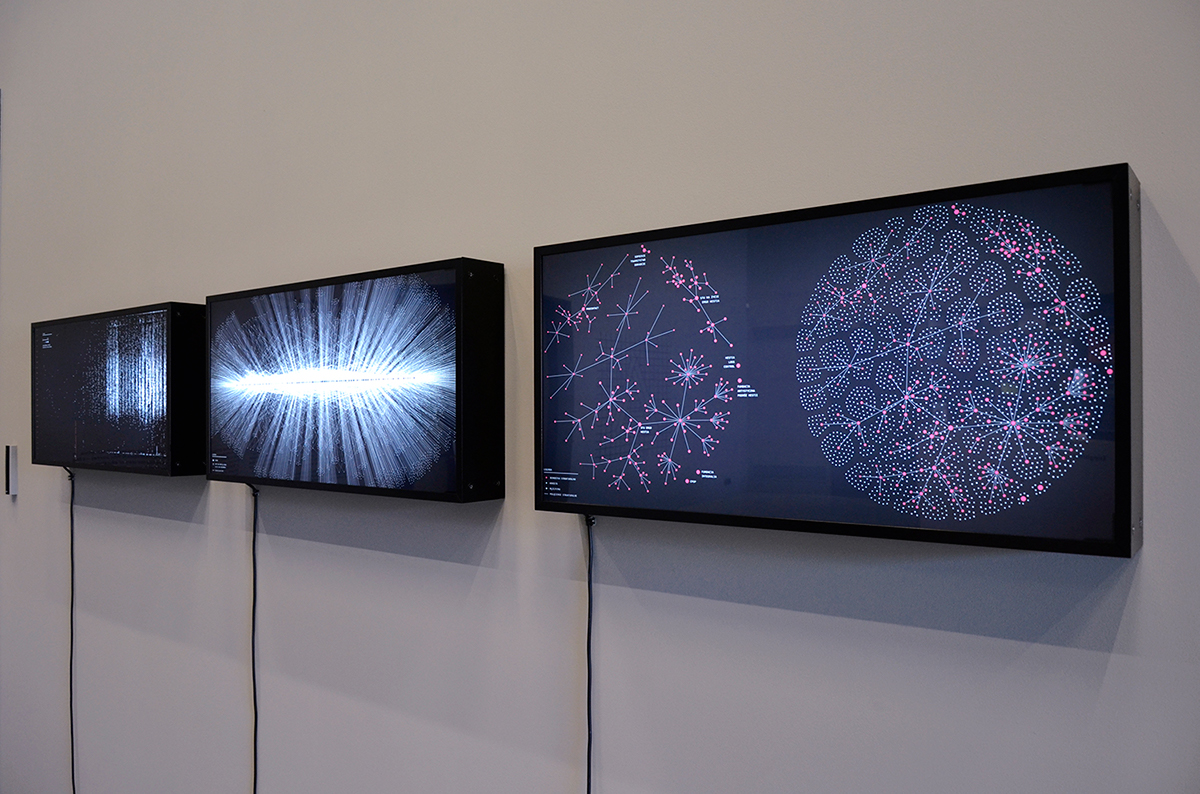
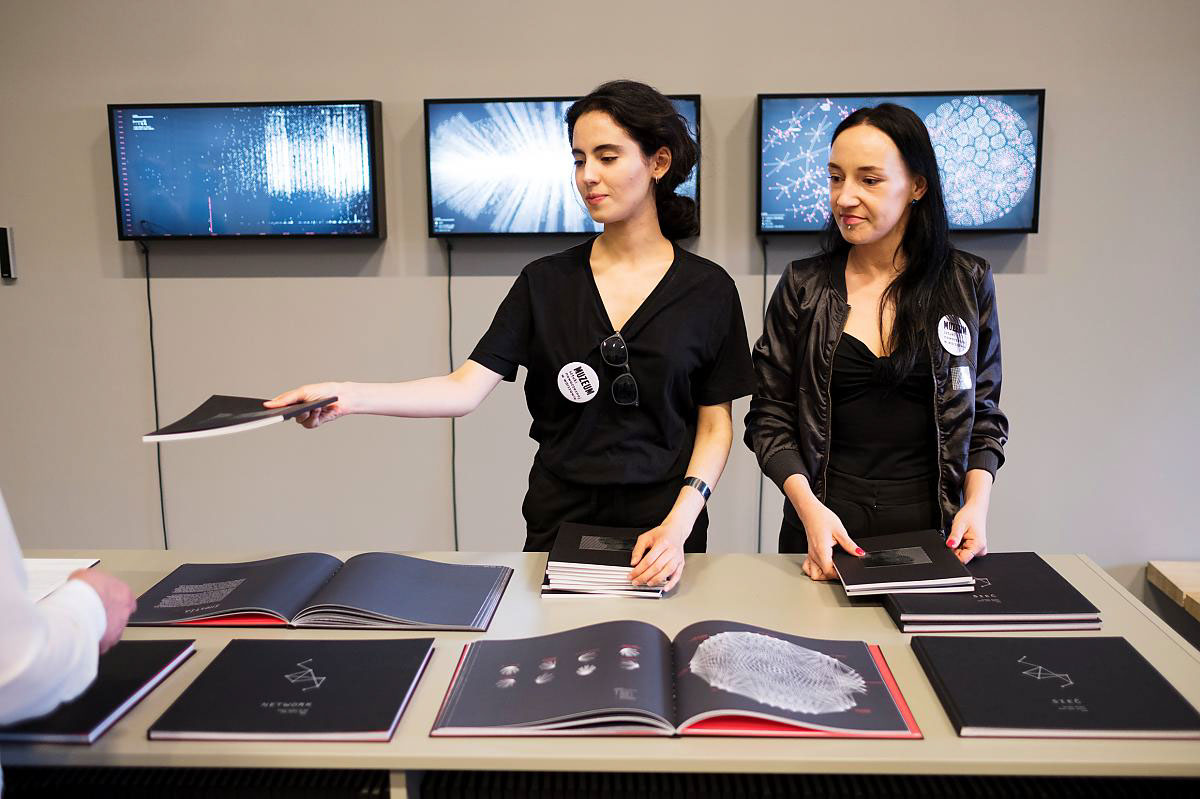
Photo by Piotr Litwic. Courtesy of Hestia Artistic Journey Foundation