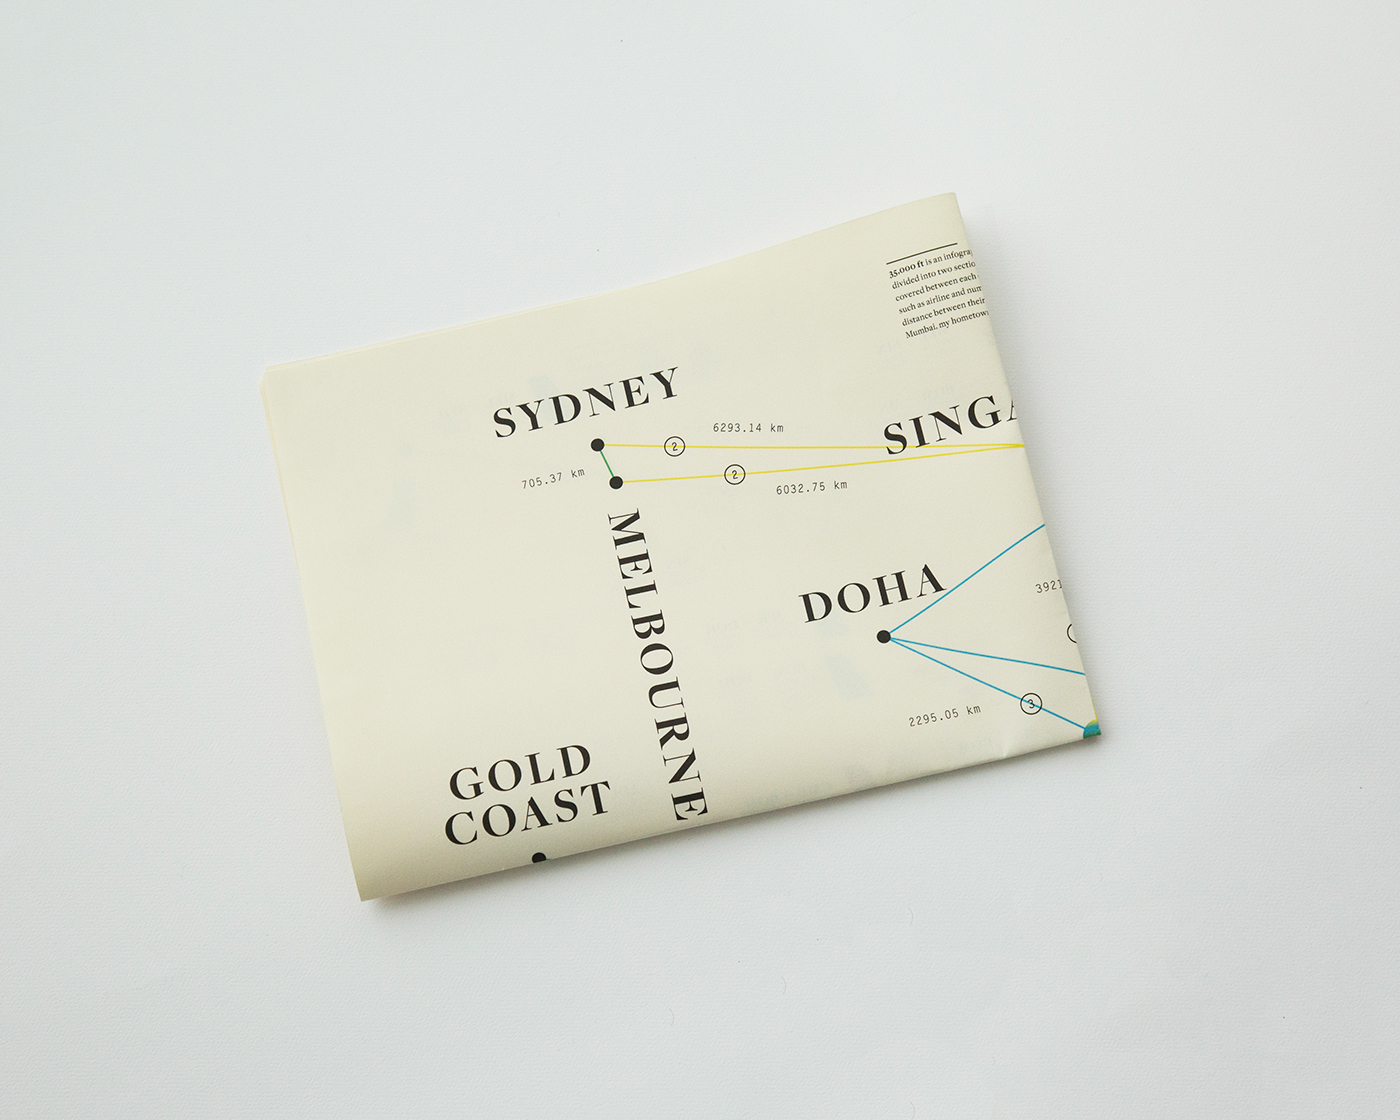
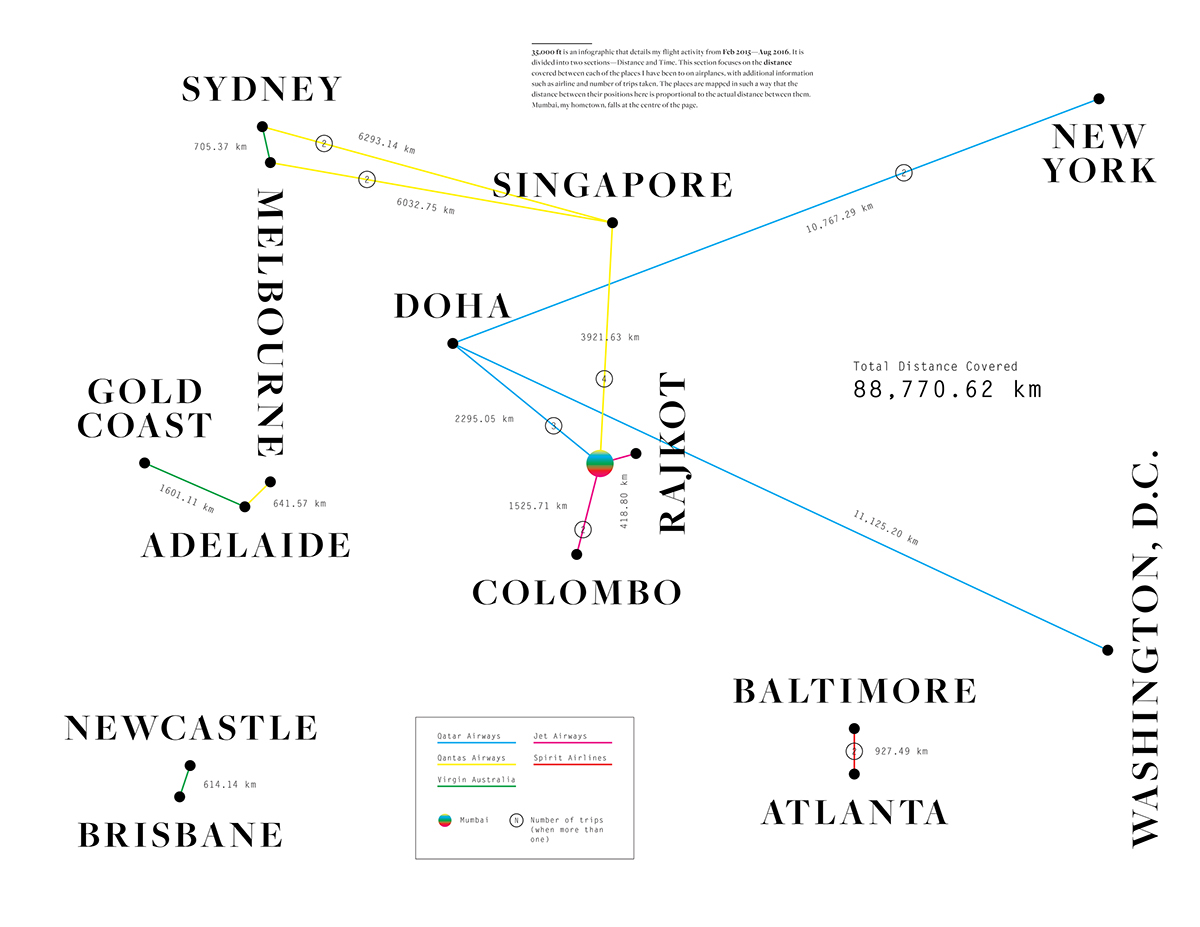
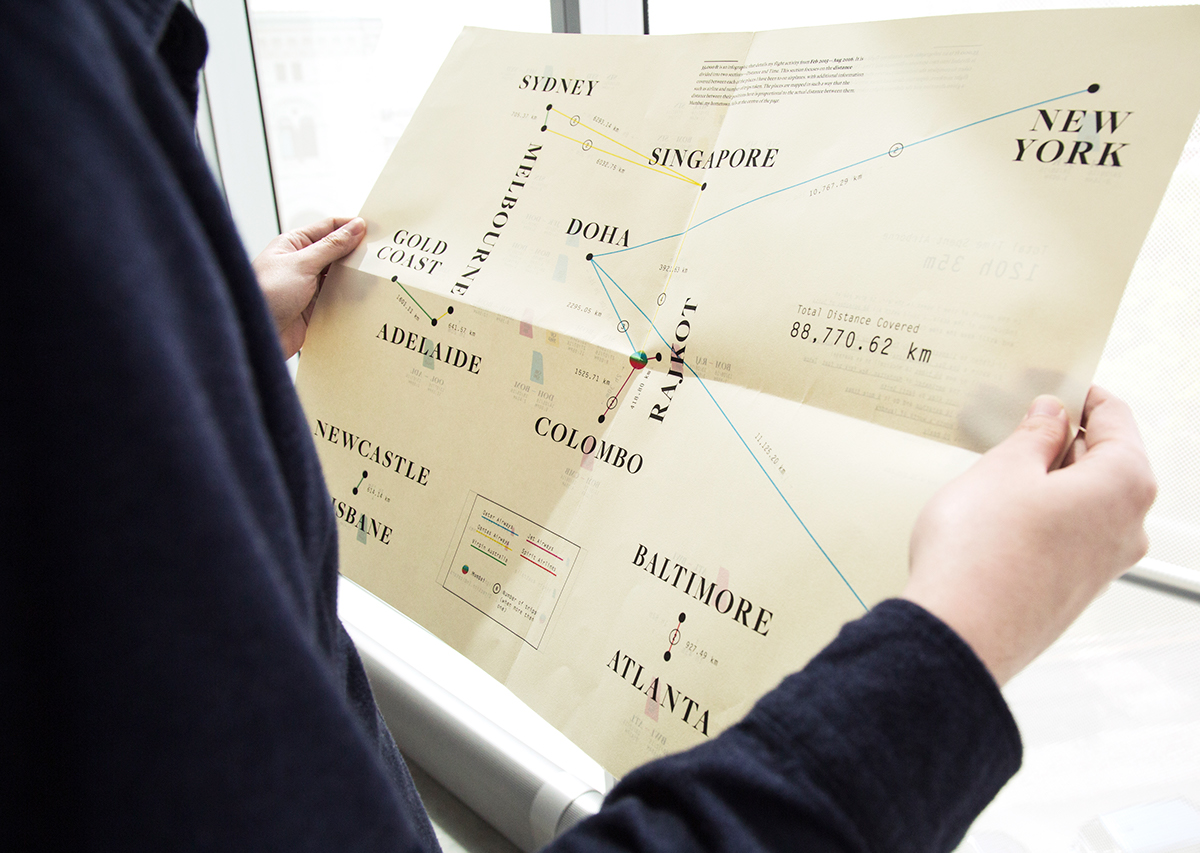
35,000 ft is an infographic that details my flight activity between Feb 2015—Aug 2016. It is divided into two sections:
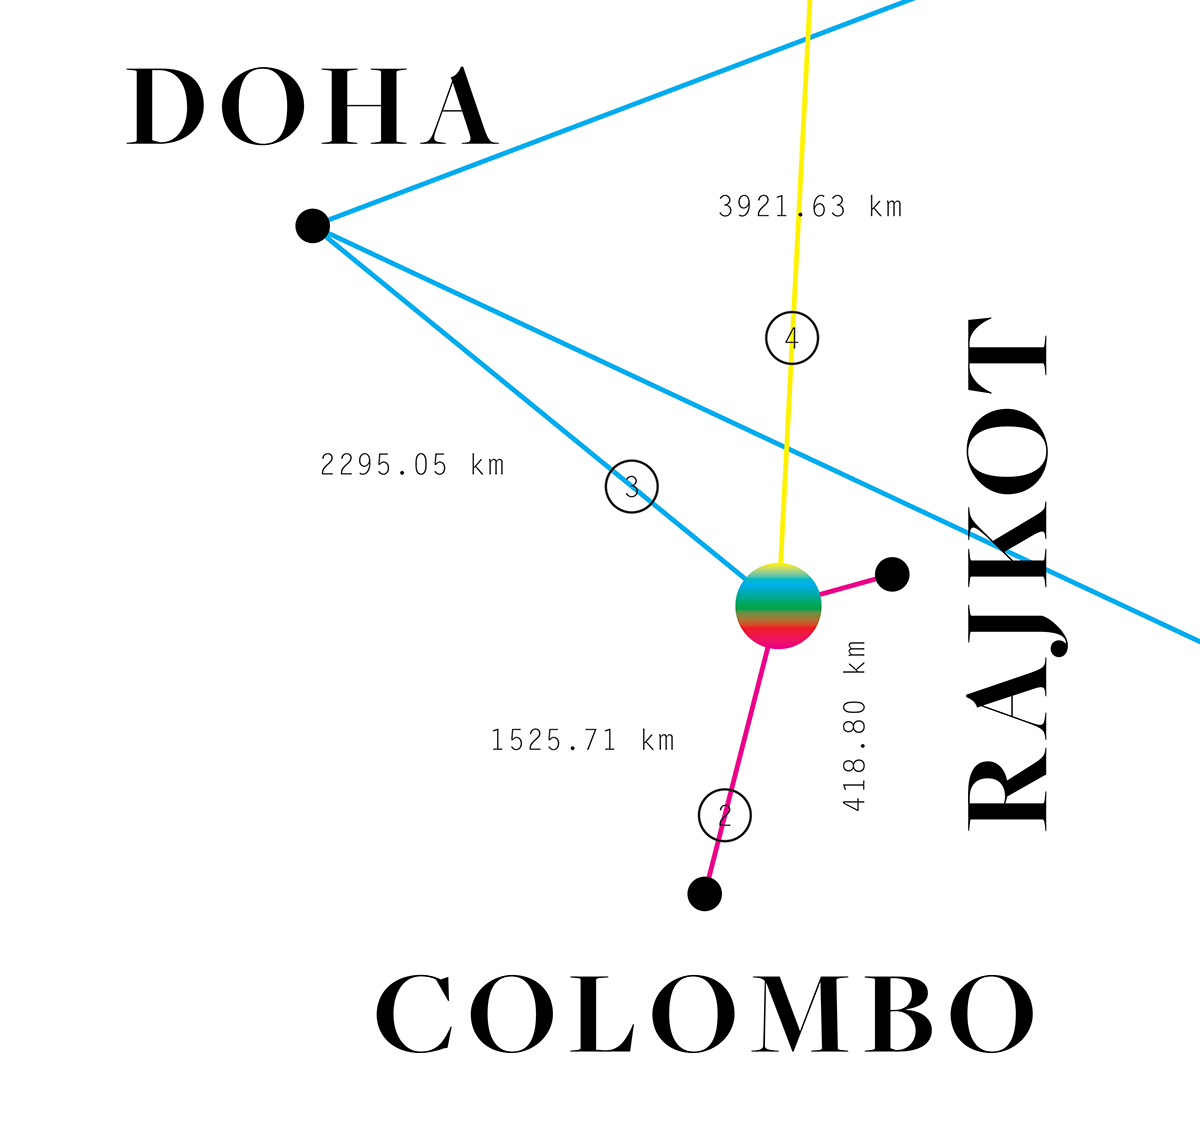
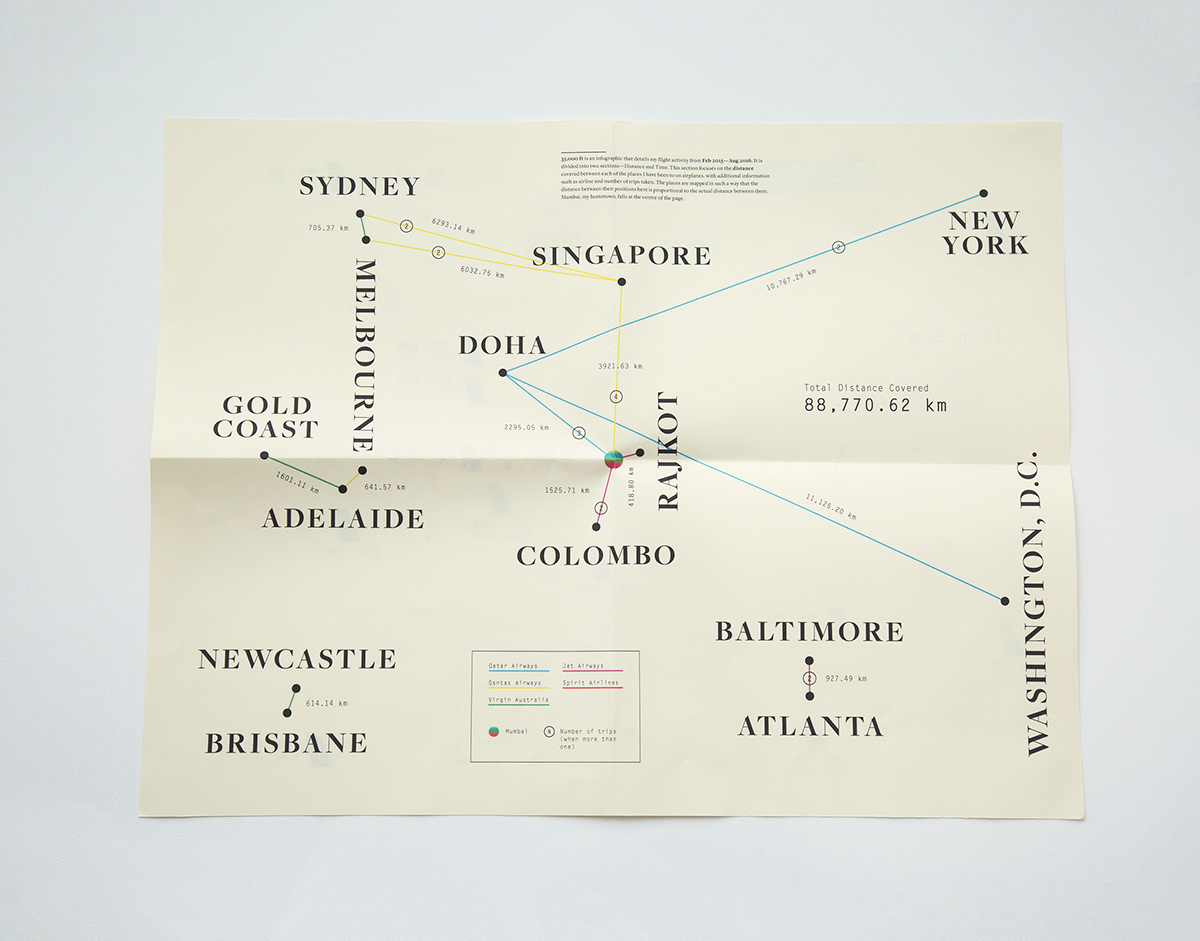
1) Distance: It focuses on the distance covered between each of the places I have been to and provides additional information such as airline and number of trips taken. The places are mapped in such a way that the distance between their positions in the infographic is proportional to the actual distance between them.
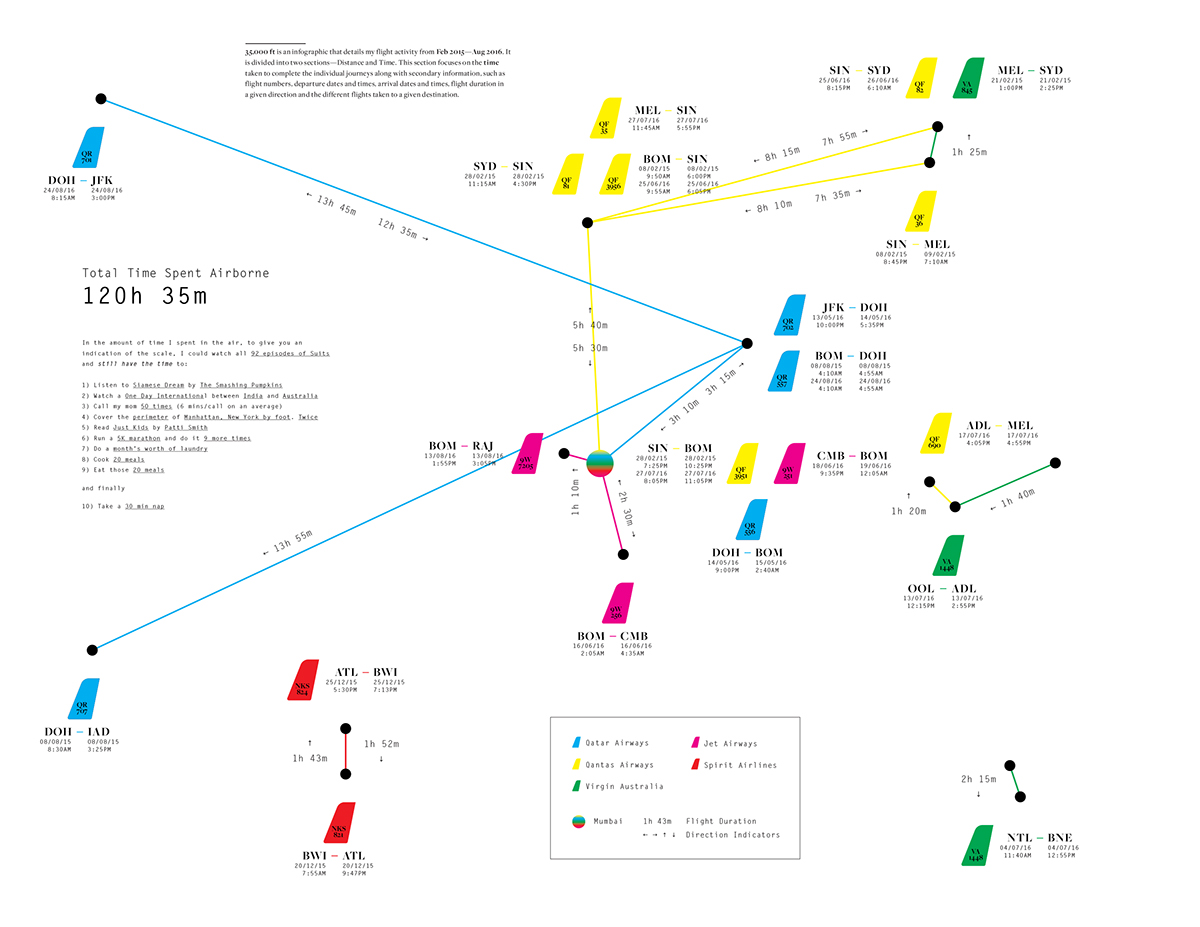
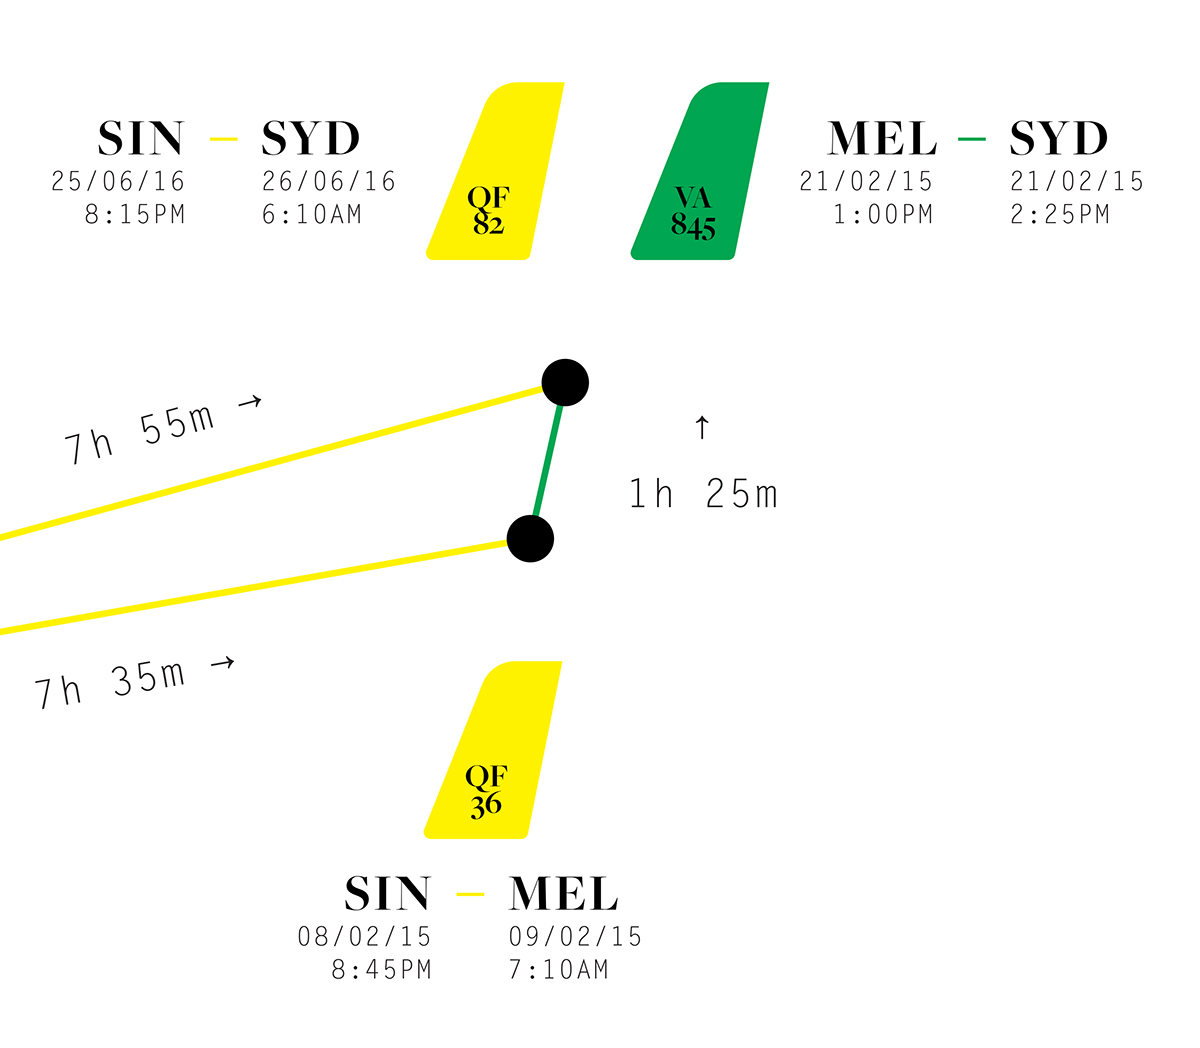
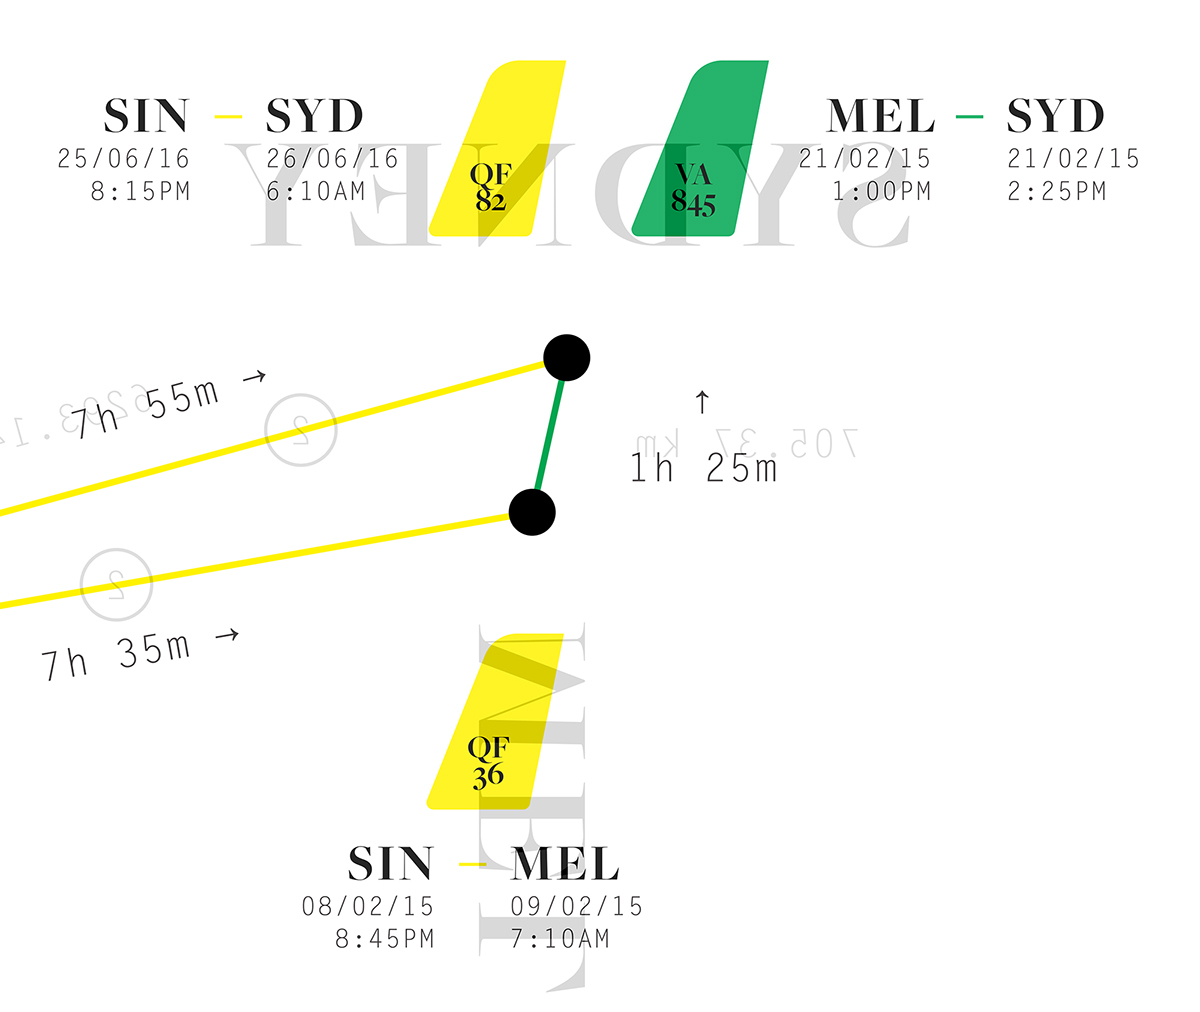
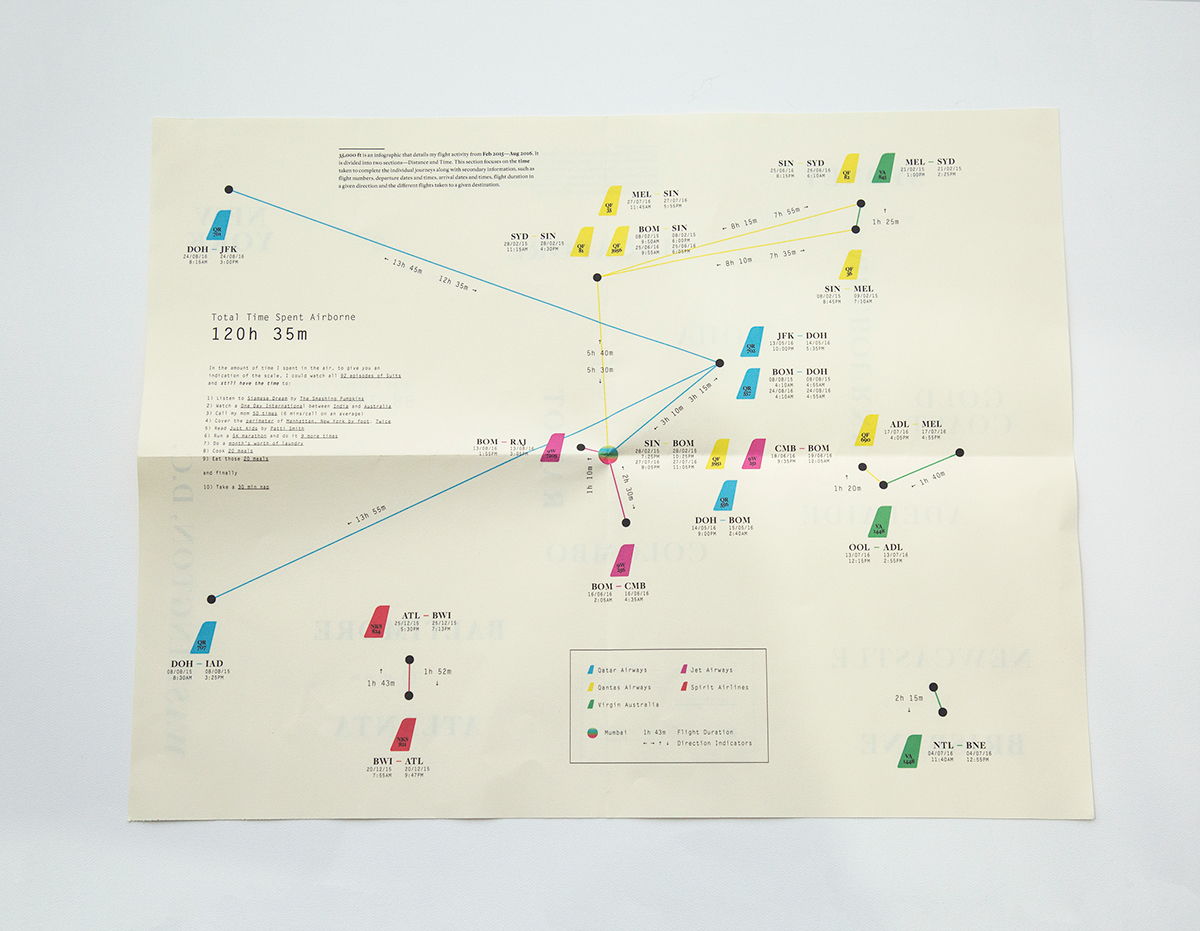
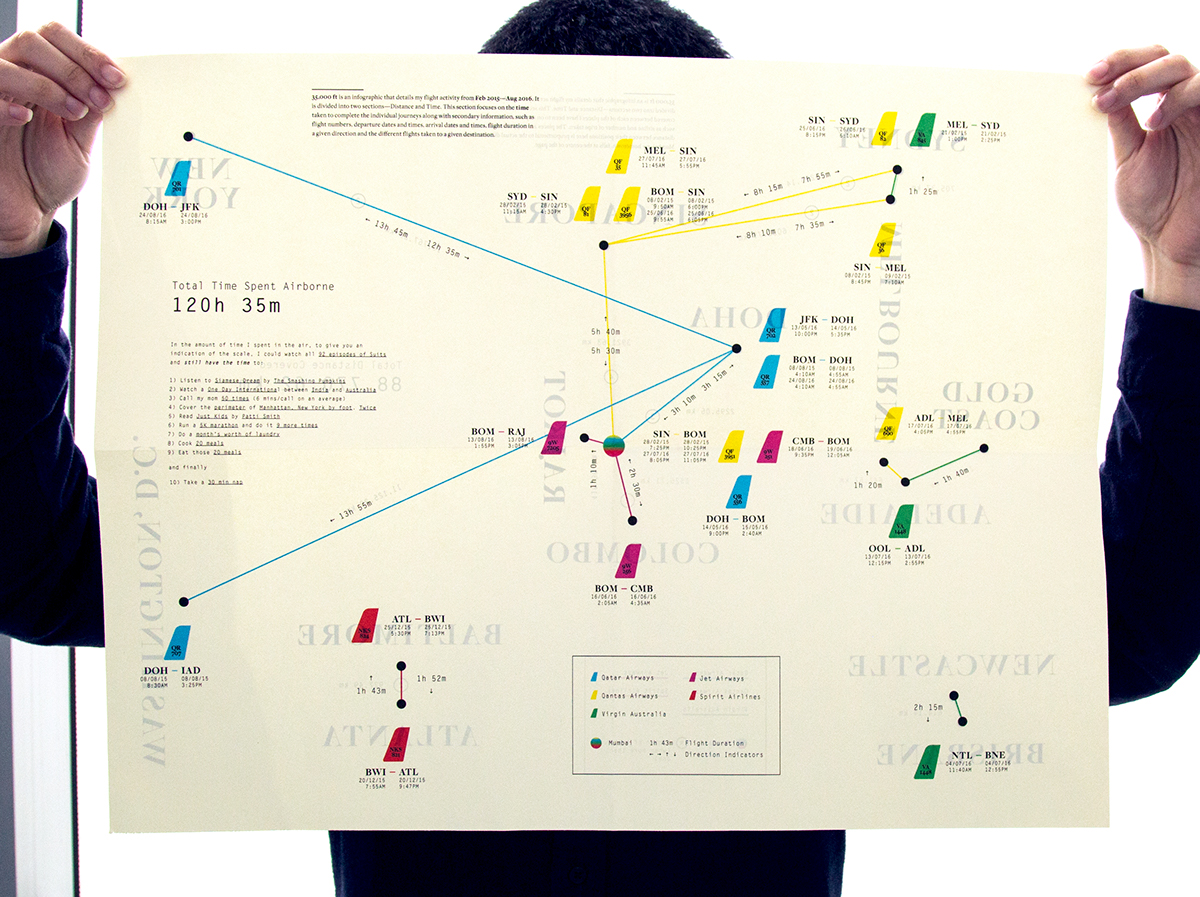
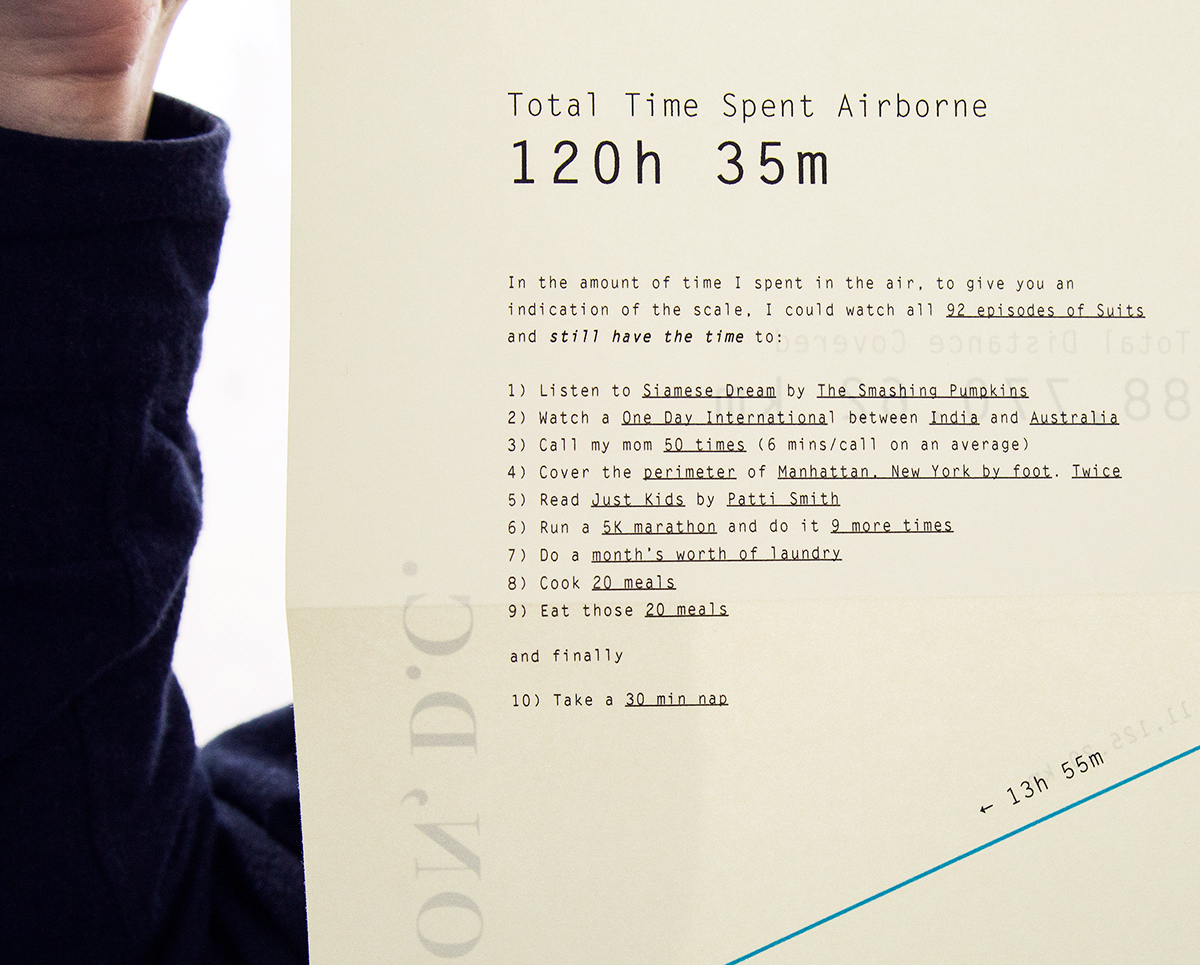
2) Time: It deals with the time taken to complete the individual journeys and lists the flight numbers, departure dates and times, arrival dates and times, the flight duration in a given direction and the different flights taken to a given destination.
The project was designed in the Graduate Typography class at the Maryland Institute College of Art (MICA) taught by Adam Lucas. The following were the project constraints:
Folded print or single-page interactive website, selective applications of colour as appropriate to the subject and type limited to the use of two typefaces (I chose Freight and Letter Gothic Std).


Both the Distance and Time sections share the same skeleton with regards to their design. However, each represents information particular to its own section. This creates a systemic overlap which helps the reader to form correlations between the sections.


Thanks to Adam Lucas for the feedback and Potch Auacherdkul & Chase Body for modeling for the photos

