


Video Keynote Presentation:
00:00-1:28: Intro / Preshow View
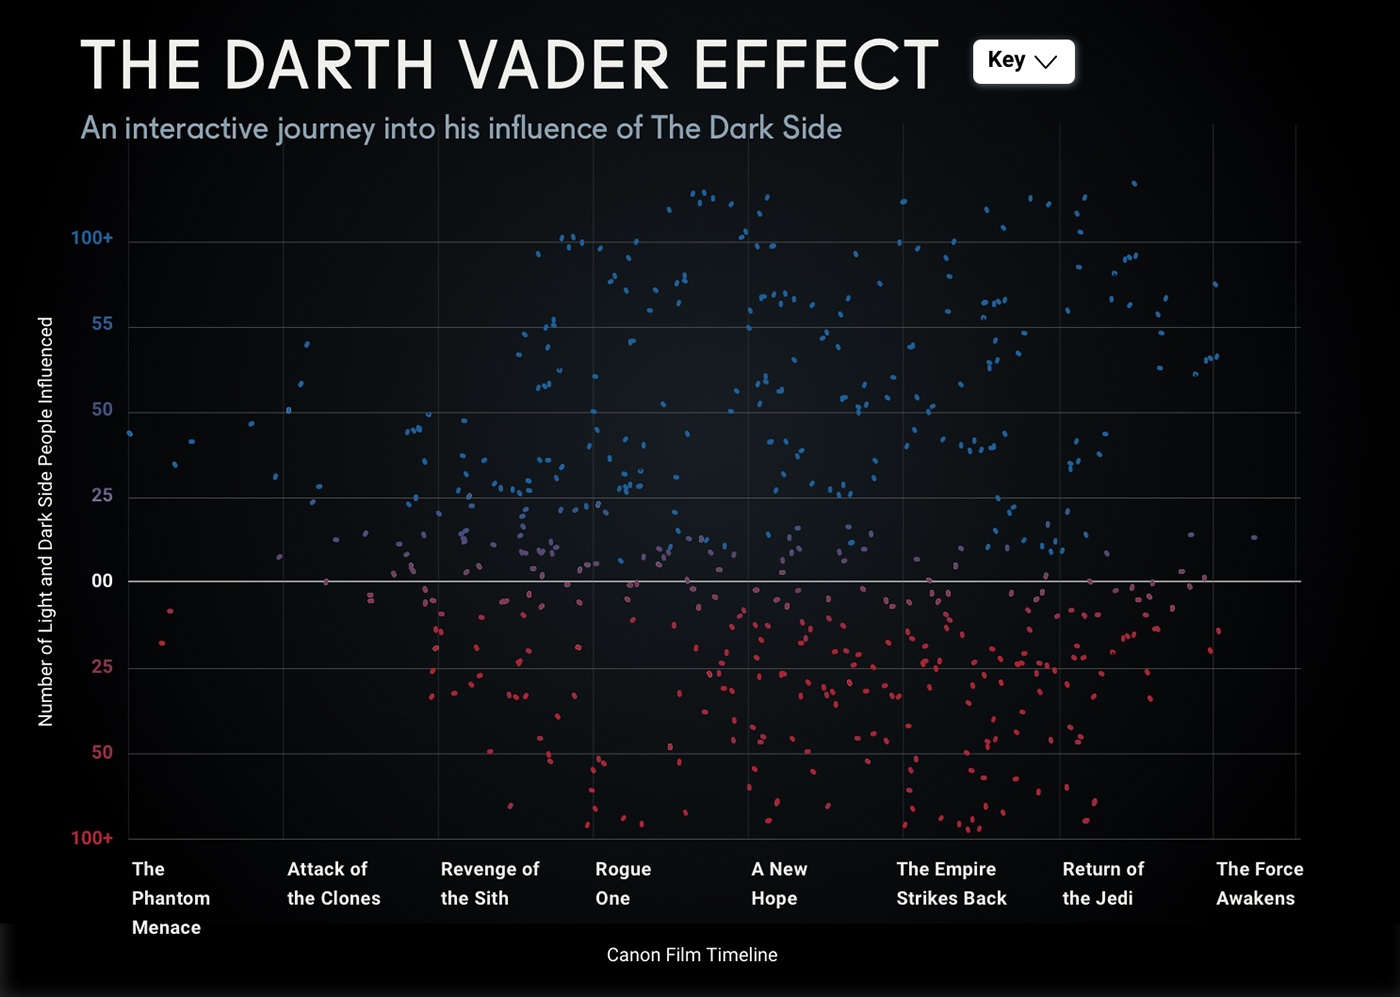
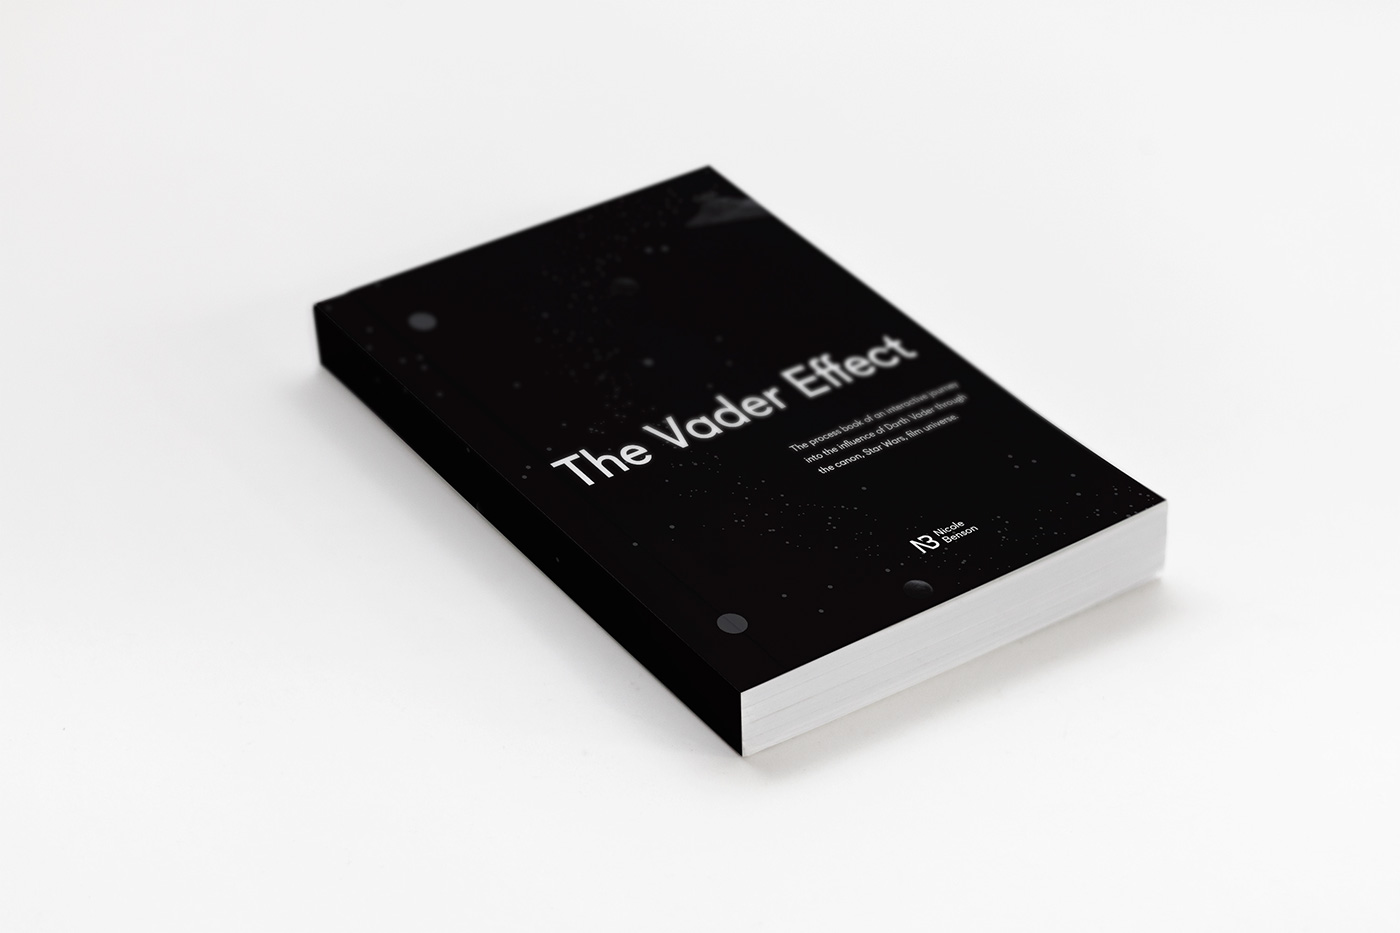
1:29-1:30 Title Screen: The Vader Effect is an interactive web interface used to understand the influence Darth Vader had on the film universe.
Abstract: In the Star Wars universe, Darth Vader's influence was the catalyst for many important events in the Galactic History. These effects are also to be known as the Vader Effect.
This leads me to my question: Did Vader have a significant influence on the Star Wars universe? Some would argue Palpatine is the real mastermind and Vader is but a pawn but I argue that without Vader, the history and growth of the Empire would be very different.
This leads me to my question: Did Vader have a significant influence on the Star Wars universe? Some would argue Palpatine is the real mastermind and Vader is but a pawn but I argue that without Vader, the history and growth of the Empire would be very different.
1:30-1:52: Star Wars is an American epic space opera franchise, centered on a film series created by George Lucas. It depicts the adventures of various characters "a long time ago in a galaxy far, far away".
1:52-2:09: Upon research, I begun breaking apart the universe which stemmed from literature, films, comics, and much more... facing information overload, I then took a step back and focused on the canon universe.
1:52-2:09: Upon research, I begun breaking apart the universe which stemmed from literature, films, comics, and much more... facing information overload, I then took a step back and focused on the canon universe.
2:09-2:11: Some things to remember when looking at this data and the canon universe is... b.b.y / a.b.y: The Battle of Yarvin on the timeline, is a major battle which lead to a galactic civil war and lead to the destruction of the Death Star. It was the Republic's first major victory.
The Force: Is an energy field that connects all living things to the galaxy. The Force is manipulated by those sensitive to it. The Way Of The Force is to follow the true path of this connection. Which stems from two paths: Light and Dark.
Dark Side: Is the side of The Force, also known an Bogan, which uses the dark side to draw power. This side uses emotions like fear, anger, hatred, and aggression. A person who uses The Dark Side is a Sith.
Light Side: Is also known as Ashla and is the aspect of The Force aligned with calmness, detachment, knowledge, and defense to follow the true path of The Light Side. A person who uses The Light Side is a Jedi.
2:12-4:53: After information overload still, I found the most important parts of Vader's timeline and how they were essential to the story down the line which then lead me to narrow my topic down even further to the canon film universe. The timeline on the top shows all the data I mapped by hand and the chart on the bottom shows a simplified timeline of just the key parts of that timeline.
4:54-5:00: Audience: Star Wars fans and enthusiasts who want to learn or understand more because this universe is often overlooked and overwhelming to understand. Information is often lost and forgotten since there is so much available.
Persona Audience: Siths Sided and Dark Sided Allies because they may want to learn about someone as historic as him and how he played a key role for the Empire during his lifetime.
5:01-5:07: What Is the Star Wars universe? It is a series of complex data.
5:07-5:14: Data visualization is a general term that describes any effort to help people understand the significance of data by placing it in a visual context. "How will I show complex data," I asked myself. I begun researching data visualizations which is a general term that describes any effort to help people understand the significance of data by visual connect.
5:15-5:21: Rules to Relate: Here I begun looking at rules in which complex data and visual design would meet and make a successful connection. These rules, by Lindy Ryan, made it possible for me to look for examples of good design that handled complex data. This data would only be good design if it communicated well and followed these rules with complex information.
5:22-6:34: History of Rock and Roll by Edward Tufte shows the evolution of Rock and Roll.
MGMT Design, Mammals Sleeping Patterns shows a timeline of the relationships in hours mammals sleep.
Connected China by Thompson Retuers of Fathom Design is a collbrative web database.
What I learned from these are: Flow is important when telling a story, minimal design helps to understand complex data, and how interactivity aids the user's experience to understand data.
6:35-7:24: Scott Kelley's A Year In Space, by TIME, was a turning point in my research because this interface showed complex data as well as a story over time. It inspired me to understand the importance of story telling with data.
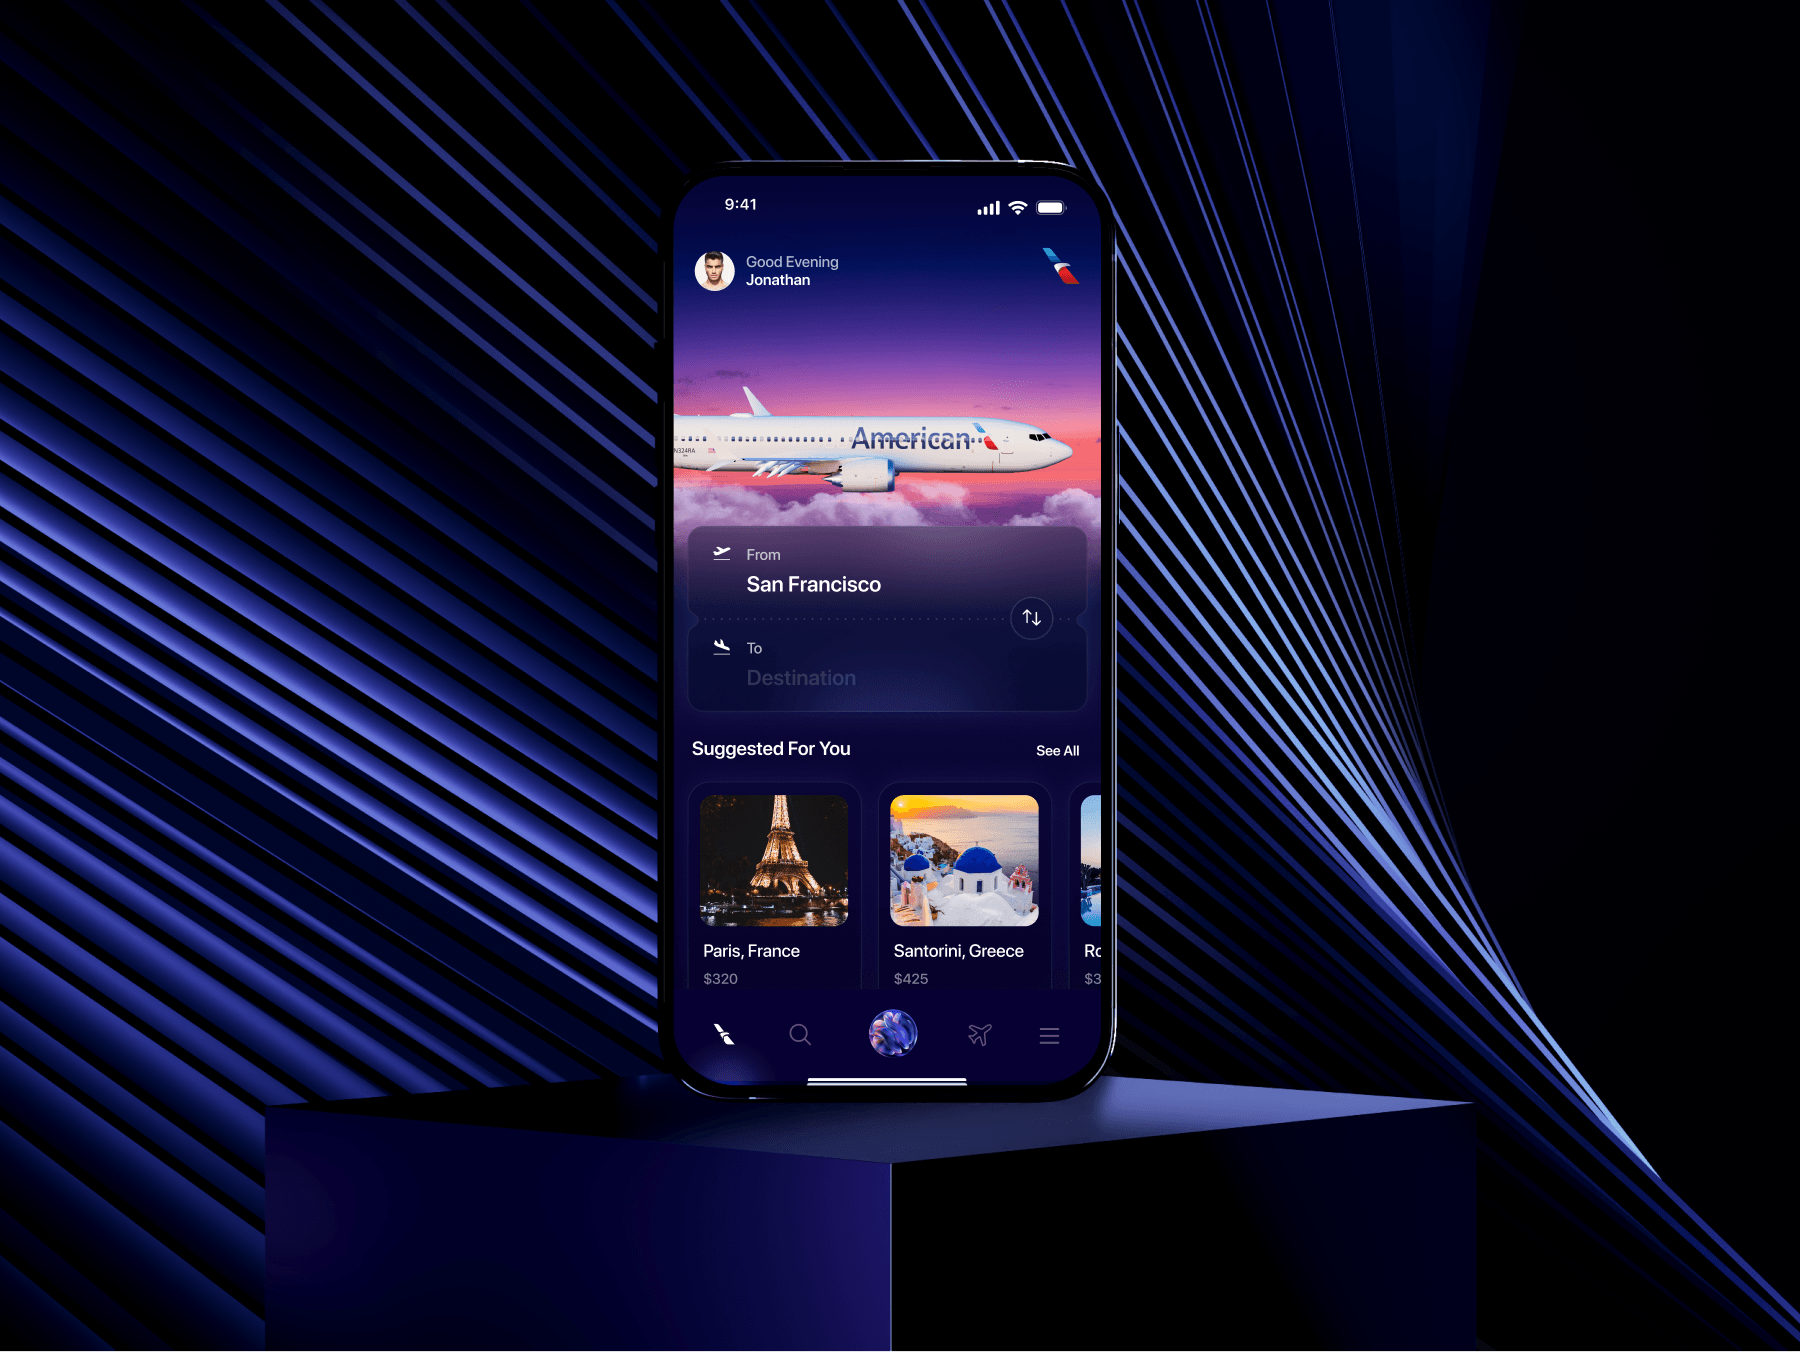
7:25-7:34: The Color Scheme: Using color from a Star Wars poster, colors were picked out to relate to my content.
7:35-END: Delieverable
Points of Interest: 7:50 Interface Overview Key
8:05: Graph Key
8:48: Graphed Point being Interacted With
8:50: Scroll to First Timeline Point
9:01: Video 1 Example... View of drop down text and video of influential scenes.
23:27: View of all screens with drop down text boxes and reshowing the graph
END: Sources and Thanks, Conclusion: I did this as my topic because I was a fan of sci-fi but did not know much about Star Wars so my goal in doing this was to gain enough knowledge to teach others and make my interest in this topic grow. The feedback I got was fantastic, I was applauded for being a "Huge Star Wars Fan who made it easy to understand Darth Vader" but everyone was very impressed to know I only became a fan after all of this research I have accomplished. It has made me appreciate the series, complex data, and infographic a lot more. Thank you for reading!