NASDAQ [2012]
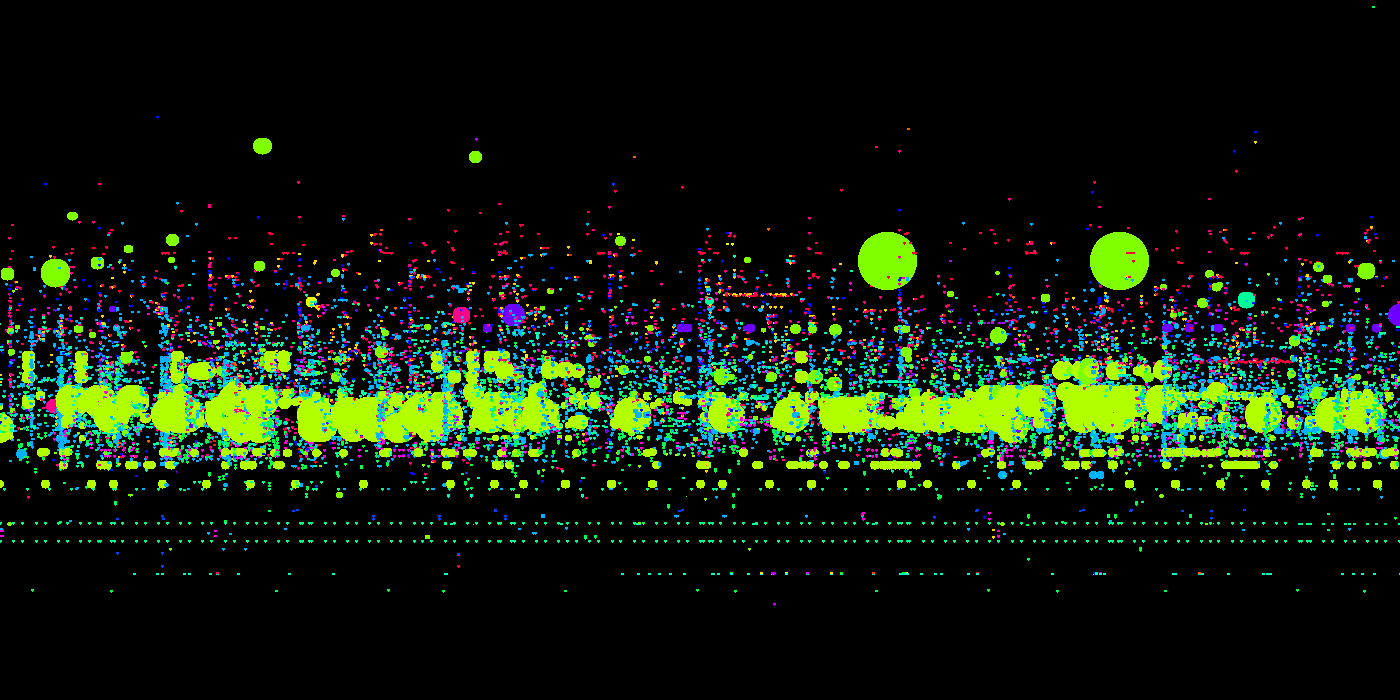
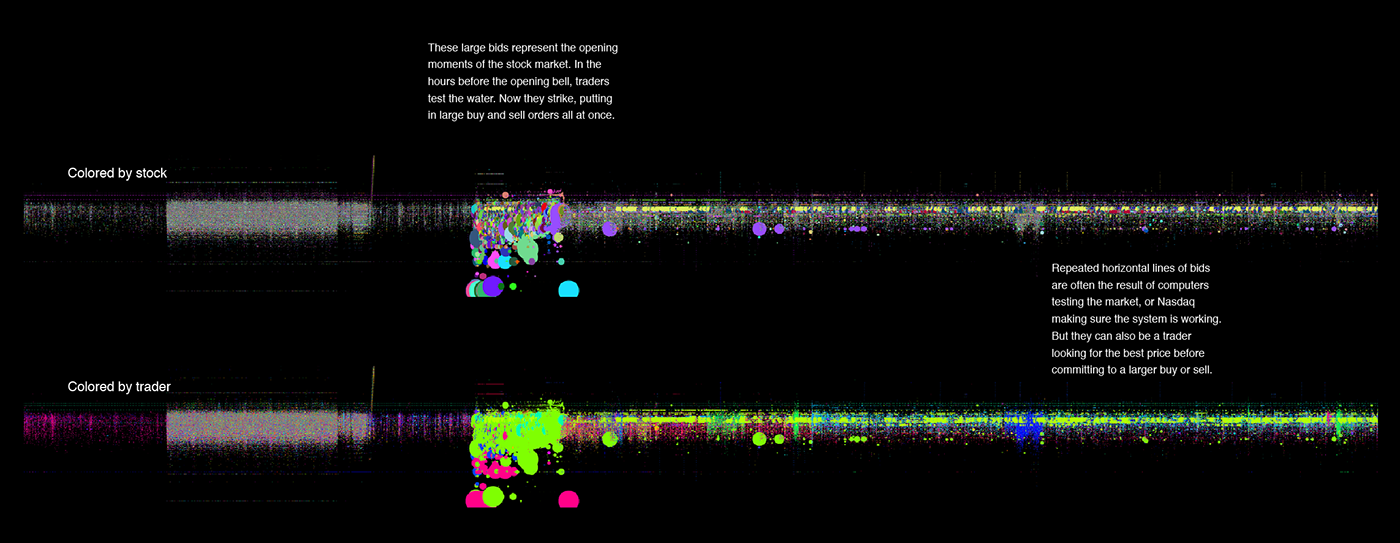
This work visualizes a single day of trading on NASDAQ.
What we like most about what’s come out of this exercise is this idea that you can visually start to detect a difference between normal and anomalous data, even for what’s normally considered data that lay people can’t understand. If we could find a way to make it easier to understand what’s happening in the markets, there’s potential here for a kind of literacy in financial data that could help to offset some of the damage done by unscrupulous experts over the past few years.