
Meteor infographic using Processing
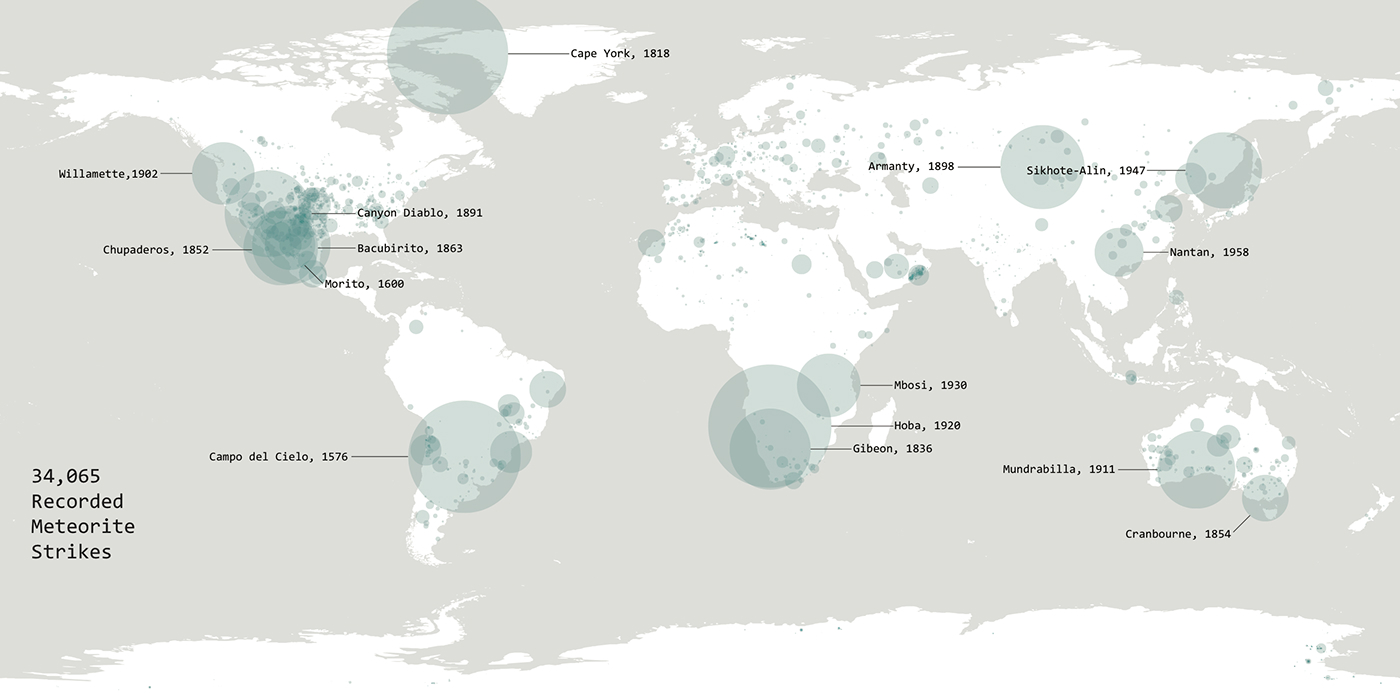
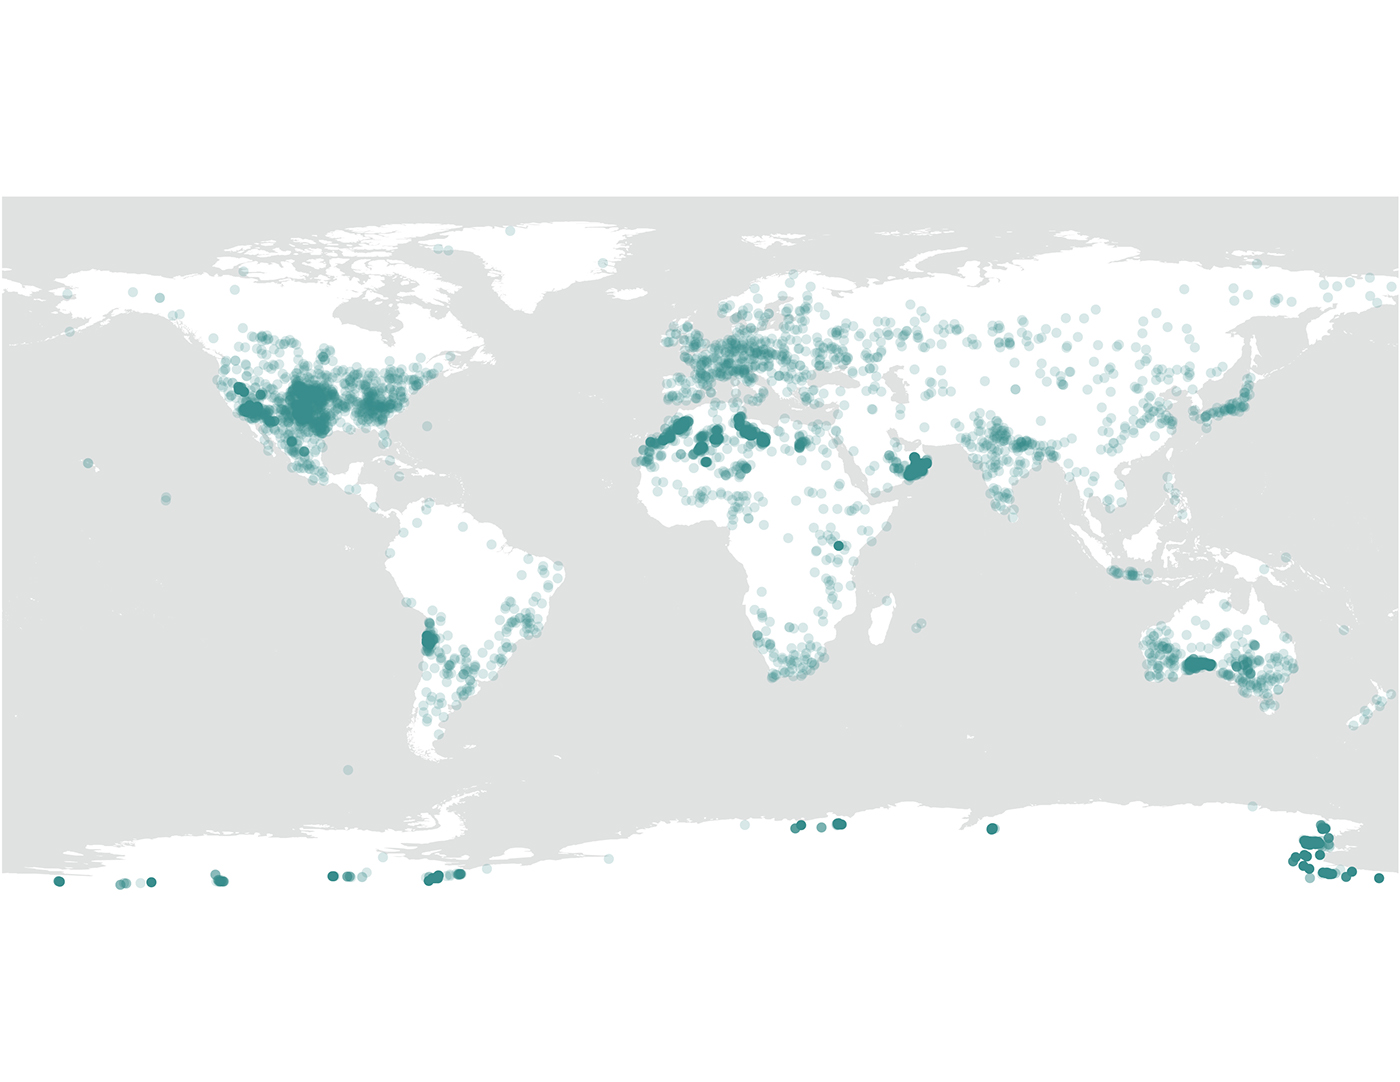
The above infographics display over 34,000 reported meteorite strikes at their geographic location. The 34,000 reports were plotted using the a program I wrote in Processing into the map. The bottom graphic displays where the meteorites landed, the ellipses have a low opacity so the darker the areas the more concentrated the strikes.
In the top graphic the ellipses display where the meteorites landed and the size of the ellipses is relative to the meteor's weight in grams. The top 15 heaviest meteorites are labeled with their location's name and the year they were discovered.


