

January 2012
Various lengths, full color
8.5×11 inches (21.6×27.9 cm)
January 2012: 17×11 inches (43.2×27.9 cm)
8.5×11 inches (21.6×27.9 cm)
January 2012: 17×11 inches (43.2×27.9 cm)
Metro areas generate nearly 90% of the nation’s gross domestic product, so if we want our economy to grow and remain globally competitive, we need to invest in urban areas. That’s the message of the Metro Economies Reports, an ongoing series produced by The United States Conference of Mayors’ (USCM) Council on Metro Economies and the New American City. Since 2007, I’ve worked with USCM to produce this series of charts that highlights important data from the reports, particularly the state of the nation’s top metro economies and the growth of U.S. gross metropolitan product, or GMP.
February 2013, page 3

November 2013, page 6

June 2014, page 1
Charts for latest report
June 2015: GMP and Employment 2014–2016
Released 19 June 2015
USCM annual meeting, San Francisco
USCM annual meeting, San Francisco
Additional info
Full report | Key findings | Press release
Full report | Key findings | Press release
Charts for past reports
June 2014
November 2013
February 2013: Report | Charts
July 2012
January 2012
June 2011
January 2010
June 2008
January 2007
November 2013
February 2013: Report | Charts
July 2012
January 2012
June 2011
January 2010
June 2008
January 2007
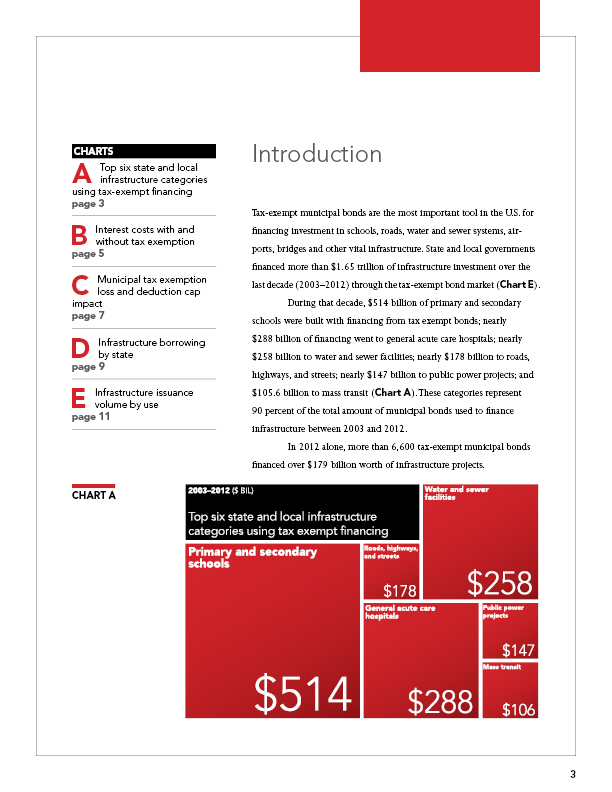
In February 2013, The United States Conference of Mayors issued a special report in conjunction with the National Association of Counties and the National League of Cities on the impact revoking tax exemption would have on the municipal bond market. I designed the interior pages of this report as well as an accompanying series of charts.