Visualizing 213,209 Non-Emergency Calls is a study of all 311 calls done in 2015 in Boston. As the final project of the class 'Data Visualization Workshop' of the MFA Information Design and Visualization, the goal was to achieve a better understanding of how to code in D3.js by creating 'reusable' code (modules). Nevertheless, the other side goal was to find out where are the 311 calls made in Boston and, specially, if it took the same amount of time to close one case in all neighborhoods.
This last purpose is what organizes all the project. The study is divided in 3 different visualizations:

Sketches by Fu Xiangyi
The filter: types of calls
Goal: interact with all the project selecting a desired type of call.
The filter updates all the charts when the user selects one specific type of call.

The map: Location of the calls
Goal: who the geographic location of the calls and identify them by the duration of the case (the bluer the dot, the less time it takes to solve the problem; the reddish the dot, the longer it takes).
Due to the large amount of calls, the map is done in canvas. The dots are updated in two different ways:
1. The main filter
2. The histogram filter, where the user can select a specific range of time by brushing over the bars.

The dots: How long does it take to close a 311 case?
Goal: study how long it takes to close a case depending on the neighborhood and the type of call.
Since the duration of an open case can be very different depending on the type of call, this visualization shows all the 'statistical' information about them: the calls that had the smallest duration (usually less than 1 hour), what were the mean and the average duration and what was the time for those that took the longest to close (some of them, more than one year).

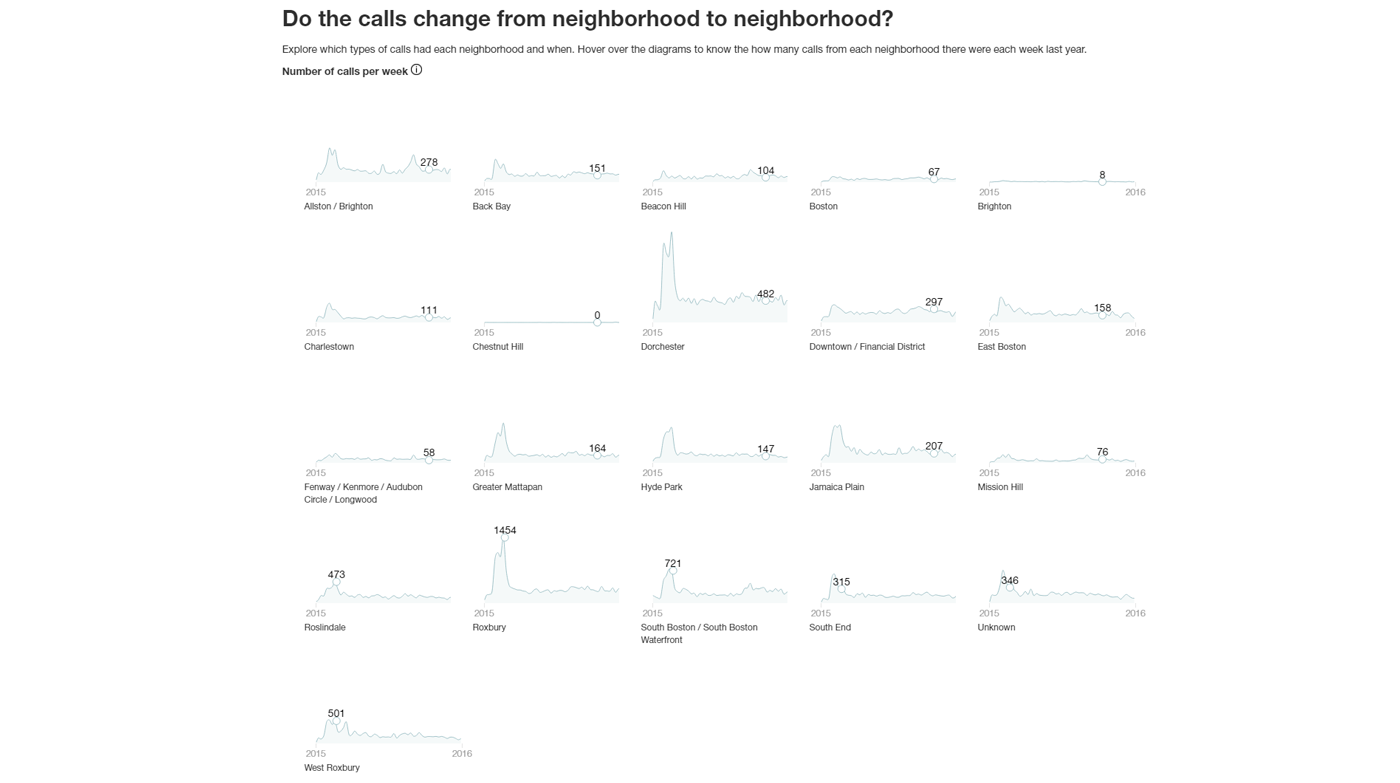
The chronology by neighborhood: Do the calls change from neighborhood to neighborhood?
Goal: study the different types and the number of calls depending on the neighborhood
The time series study the number of calls per neighborhood showing the differences in number and time between them.

The data
The dataset used is '311, Service Request' from the City of Boston website. Due to the number of calls and the size of the data, it was decided to only study those calls done during 2015, focusing in specific fields: open_dt, close_dt, type, location, neighborhood, latitude and longitude.
The code
The project is done with D3.js (visualizations), Crossfilter.js (for filtering and updating the data) and canvas (for drawing the map).

