Project Overview
TJ Analytics is a web analytics service created to track and report ad related statistics inside TrafficJunky.
Information provided here is limited due to non-disclosure agreement.
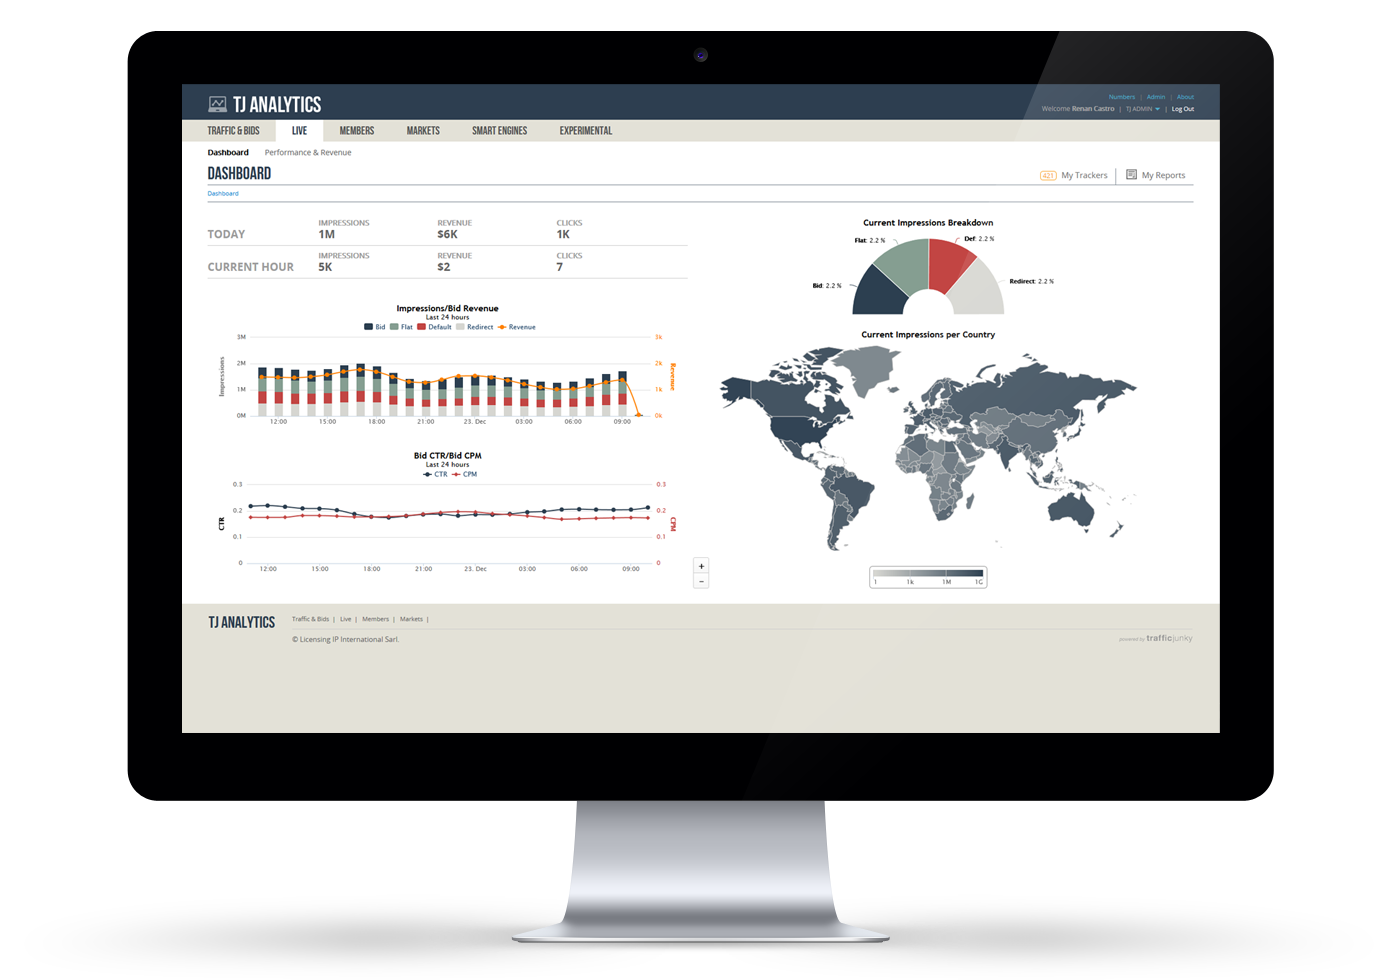
TJ Analytics page example
Context
Soon after I was hired as the first UX Designer of the TrafficJunky team, we also had the first Data Scientist joining in. We spent our first few weeks understanding what TrafficJunky was, meeting the people involved and analyzing the system.
I detailed TrafficJunky as another Behance project so you can click on the project name (TrafficJunky) to have a better understanding of it
Interviews
Various people inside the company use TrafficJunky on a daily basis, so I started by scheduling individual interviews with managers, team leads and some key users from different departments who where related to the development of TrafficJunky or who used it regularly.
From the interviews we could notice there were a lot of reports being requested on a daily basis. Developers would run a query on the database and export the results to give to another department. If the developer didn’t have time, employees would wait for more than a day or two for the report.

Contextual Inquiry
During the interviews we acquired an idea of longterm goals for the project and we could identify users from different departments that we could use for a Contextual Inquiry. I’ve got all team leads and managers involved on board and started visiting these users and staying with them for 1h in average. They performed their regular tasks while I observed and took notes. Occasionally I would ask them why they were performing certain actions and what was their goal when doing it.
This method allowed me to getter a lot of information on how people were actually using the system and generated a lot of ideas on how to streamline the process and automate some tasks.
Design Phase
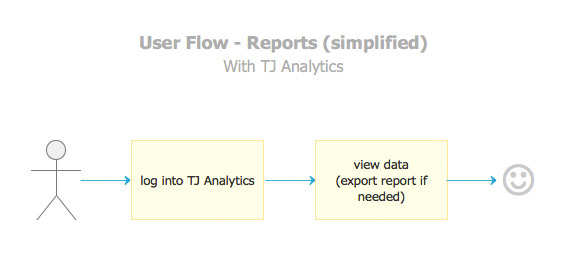
We concluded during the research phase that we could reduce the amount of work for employees on different departments if we created an interface where they could get their own reports instead of asking other departments for it.
Because the Data Science team also wanted to improve the data structure present at the time, we decided to create TJ Analytics which would provide an API for TrafficJunky to get all the needed data.
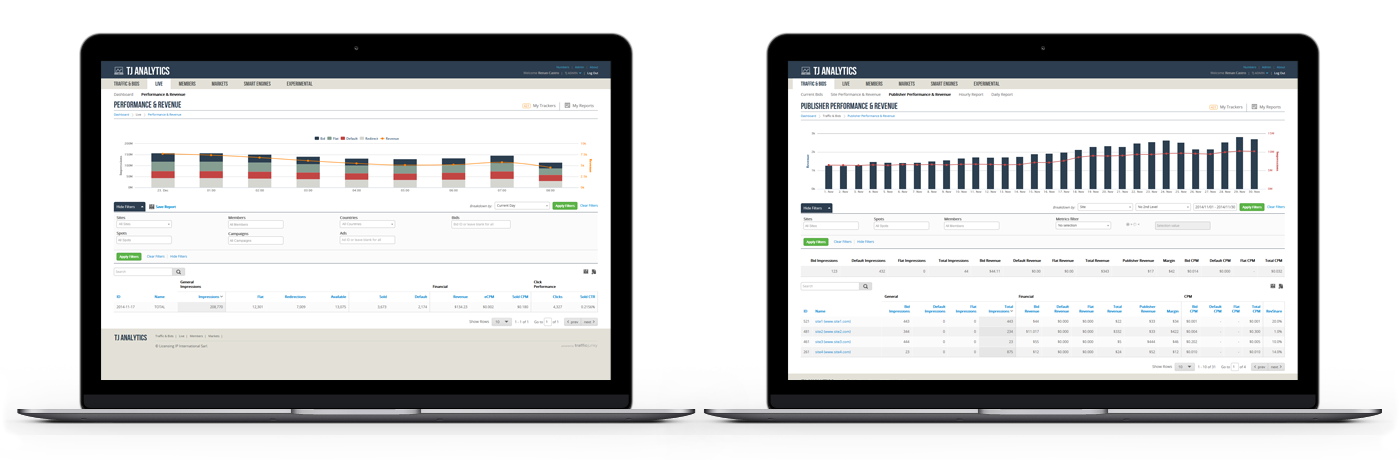
TJ Analytics' reports
Iterations
While Data Science created the logic behind it all, my team worked on mockups made on Photoshop to get validations from future users of the tool.
Since most users were used to receive a report in a certain way, we started by porting the same reports into the tool. As we saw opportunities to make a report more friendly, we performed simple Multivariate Test where we presented both reports to customers and checked if they had an easier time getting the information.
We scheduled a weekly Usability Testing session where we would test more complex interactions, like using filters to generate a report. Since all our future users were inside the building, we could invite people from different departments without repeating users for the same task.
Conclusion
With the product ready, users from various departments were able to access the interface and check all the data they needed. We saved hours of waiting time and also hours of developers time running queries and sending reports by email.