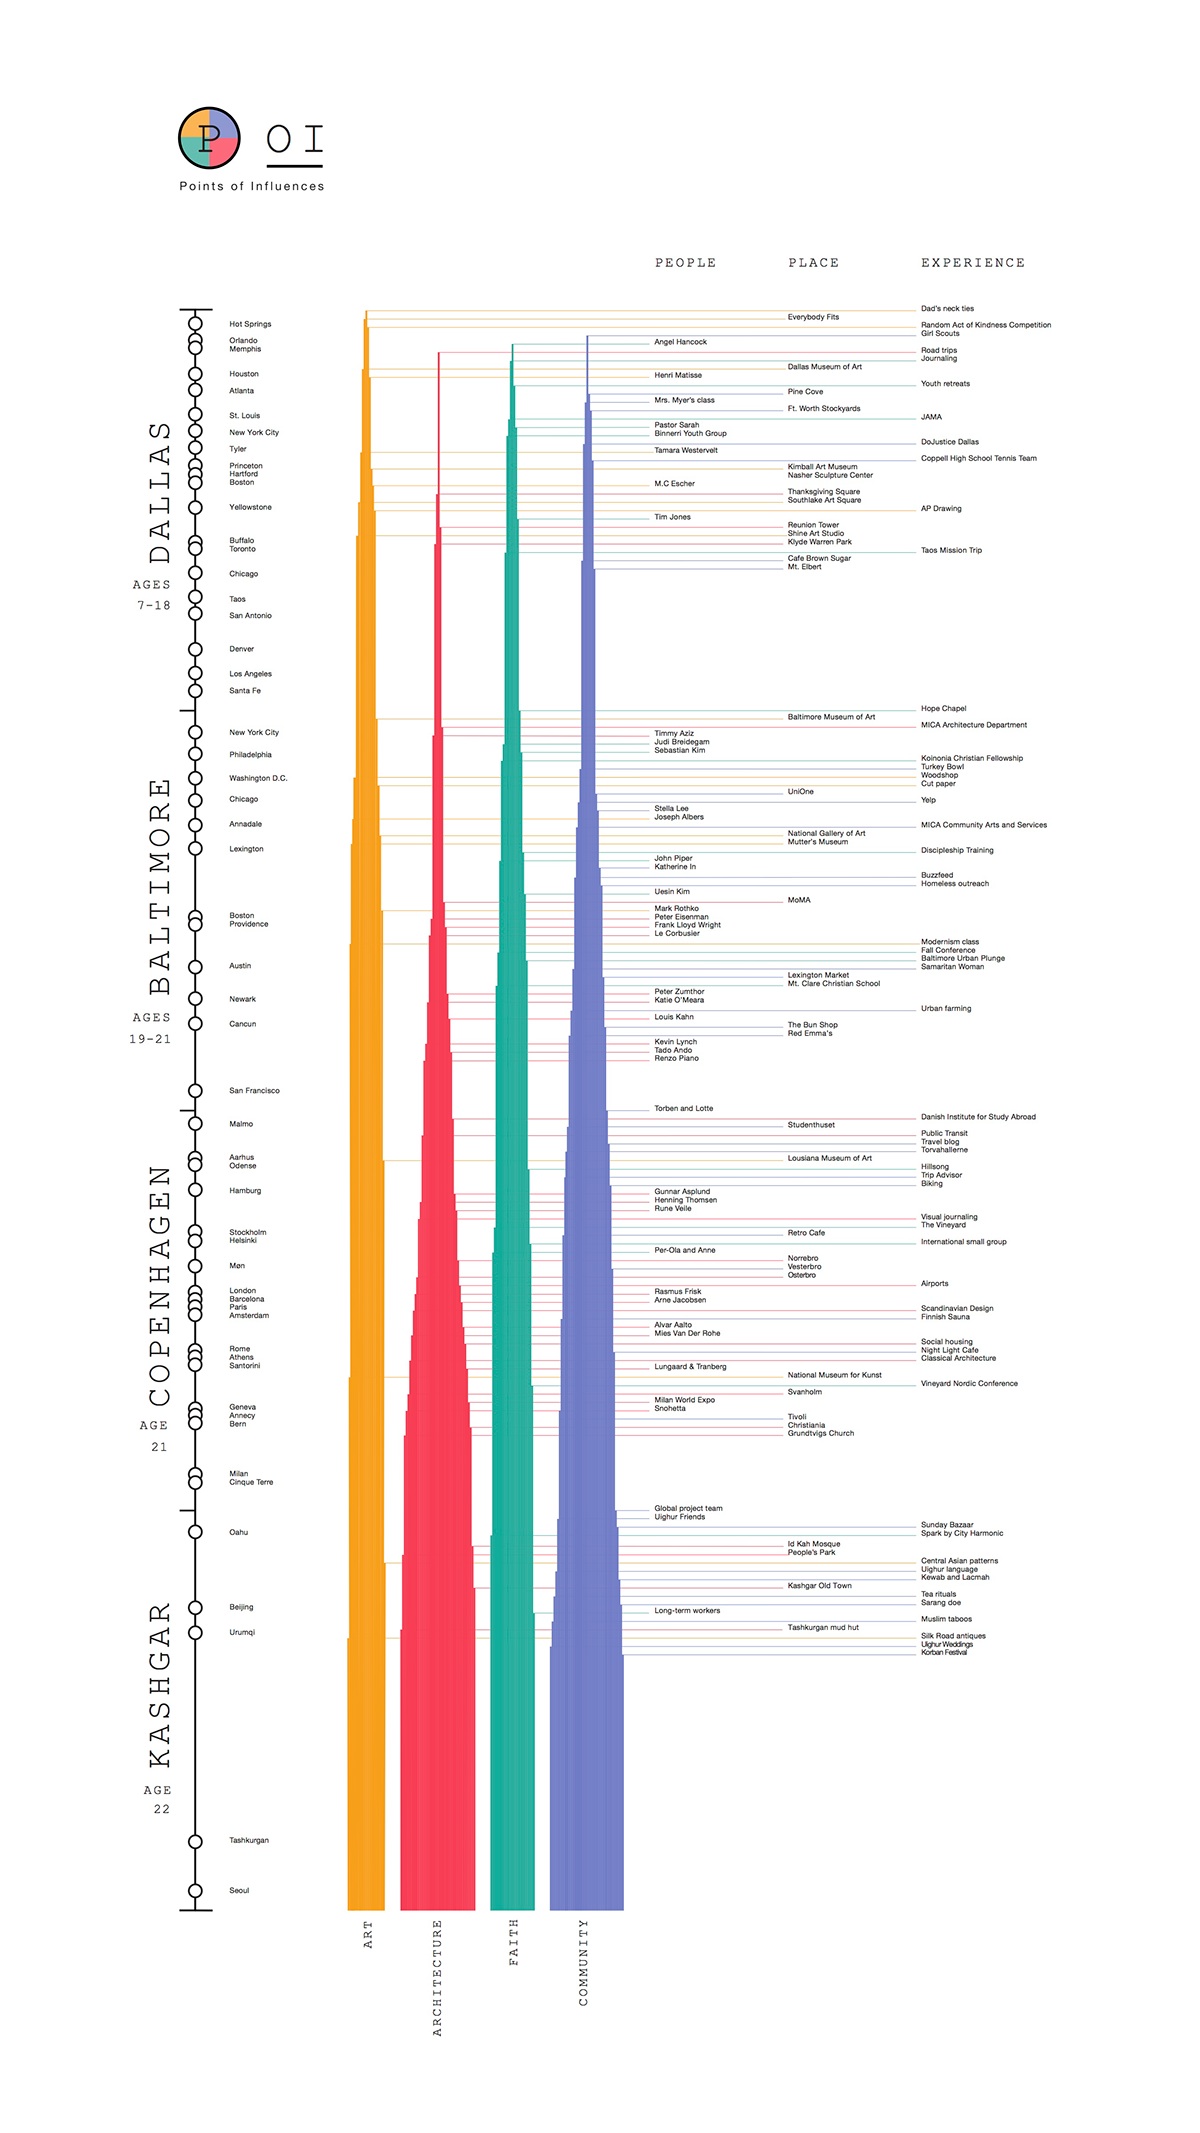
Points of Influences (2015)
This data visualization maps personal influences that has shaped me as a designer. Influences from people, places, and experiences are categorized into four keywords that encompass my values: art, architecture, faith, and community. Places I resided in is formatted as a vertical timeline and, it corresponds to the influences I've been exposed to.