Wired Italia
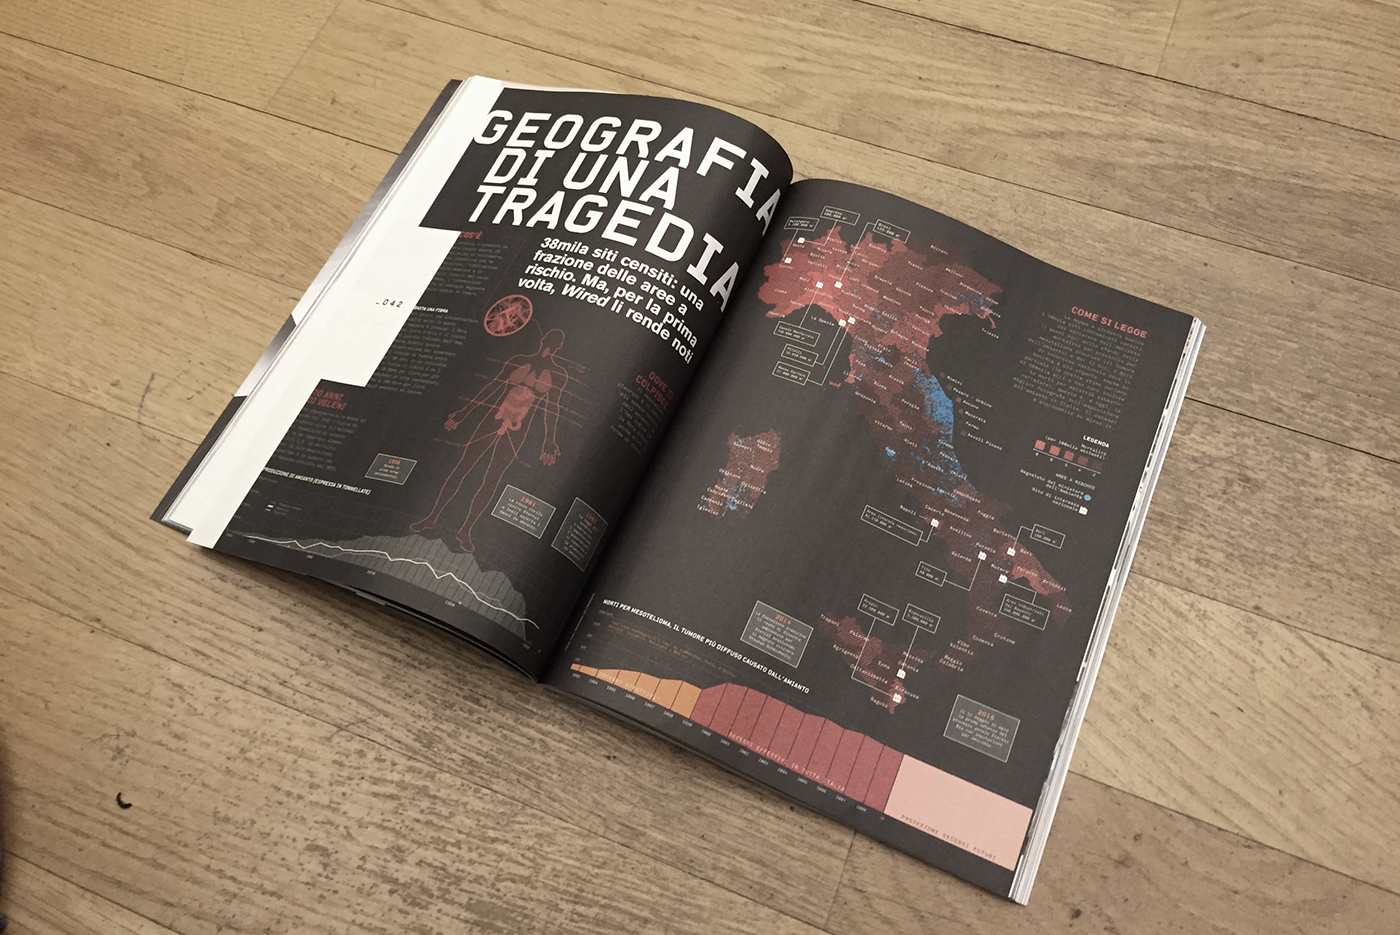
Map, graphs and illustration for the data-driven investigation about asbestos in italy.
Art Director: Corrado Garcia | Layout: Daniela Sanziani

There is correlation between contamination of asbetos and a kind of cancer, mesothelioma.
The density of red lines misure the mortality by mesothelioma, a cancer caused by asbestos.
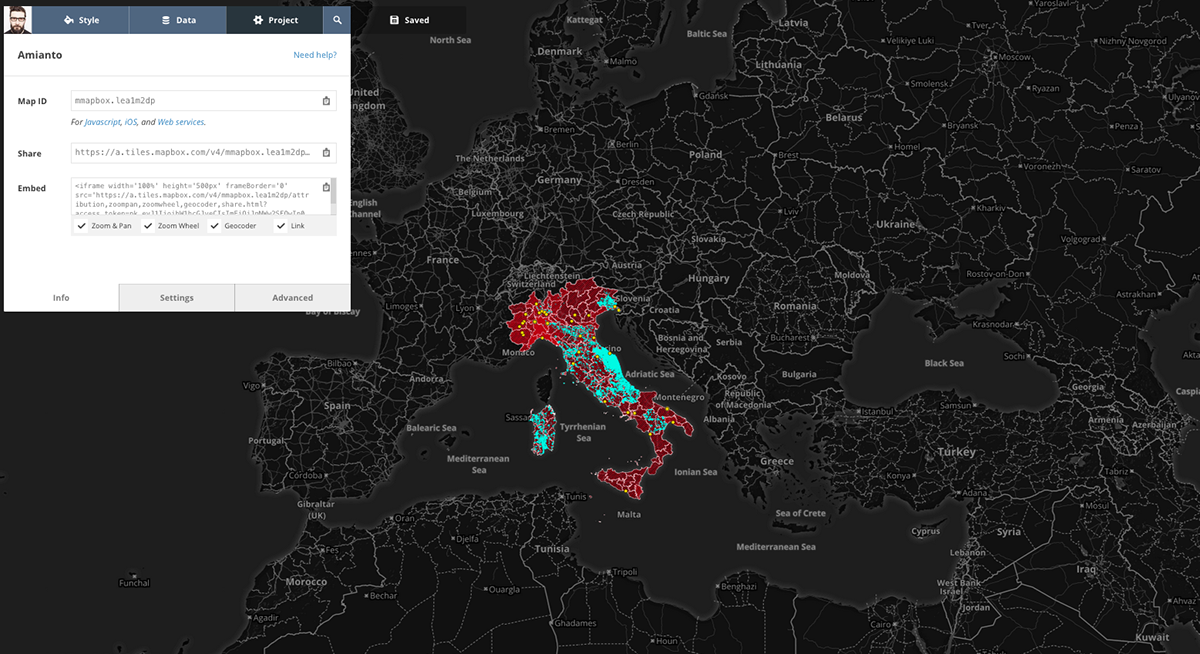
In blue dots the asbestos area polluted surveyed by the Italian govenrment.
In blue dots the asbestos area polluted surveyed by the Italian govenrment.
The icons show the national point of interest, areas polluted like factories.
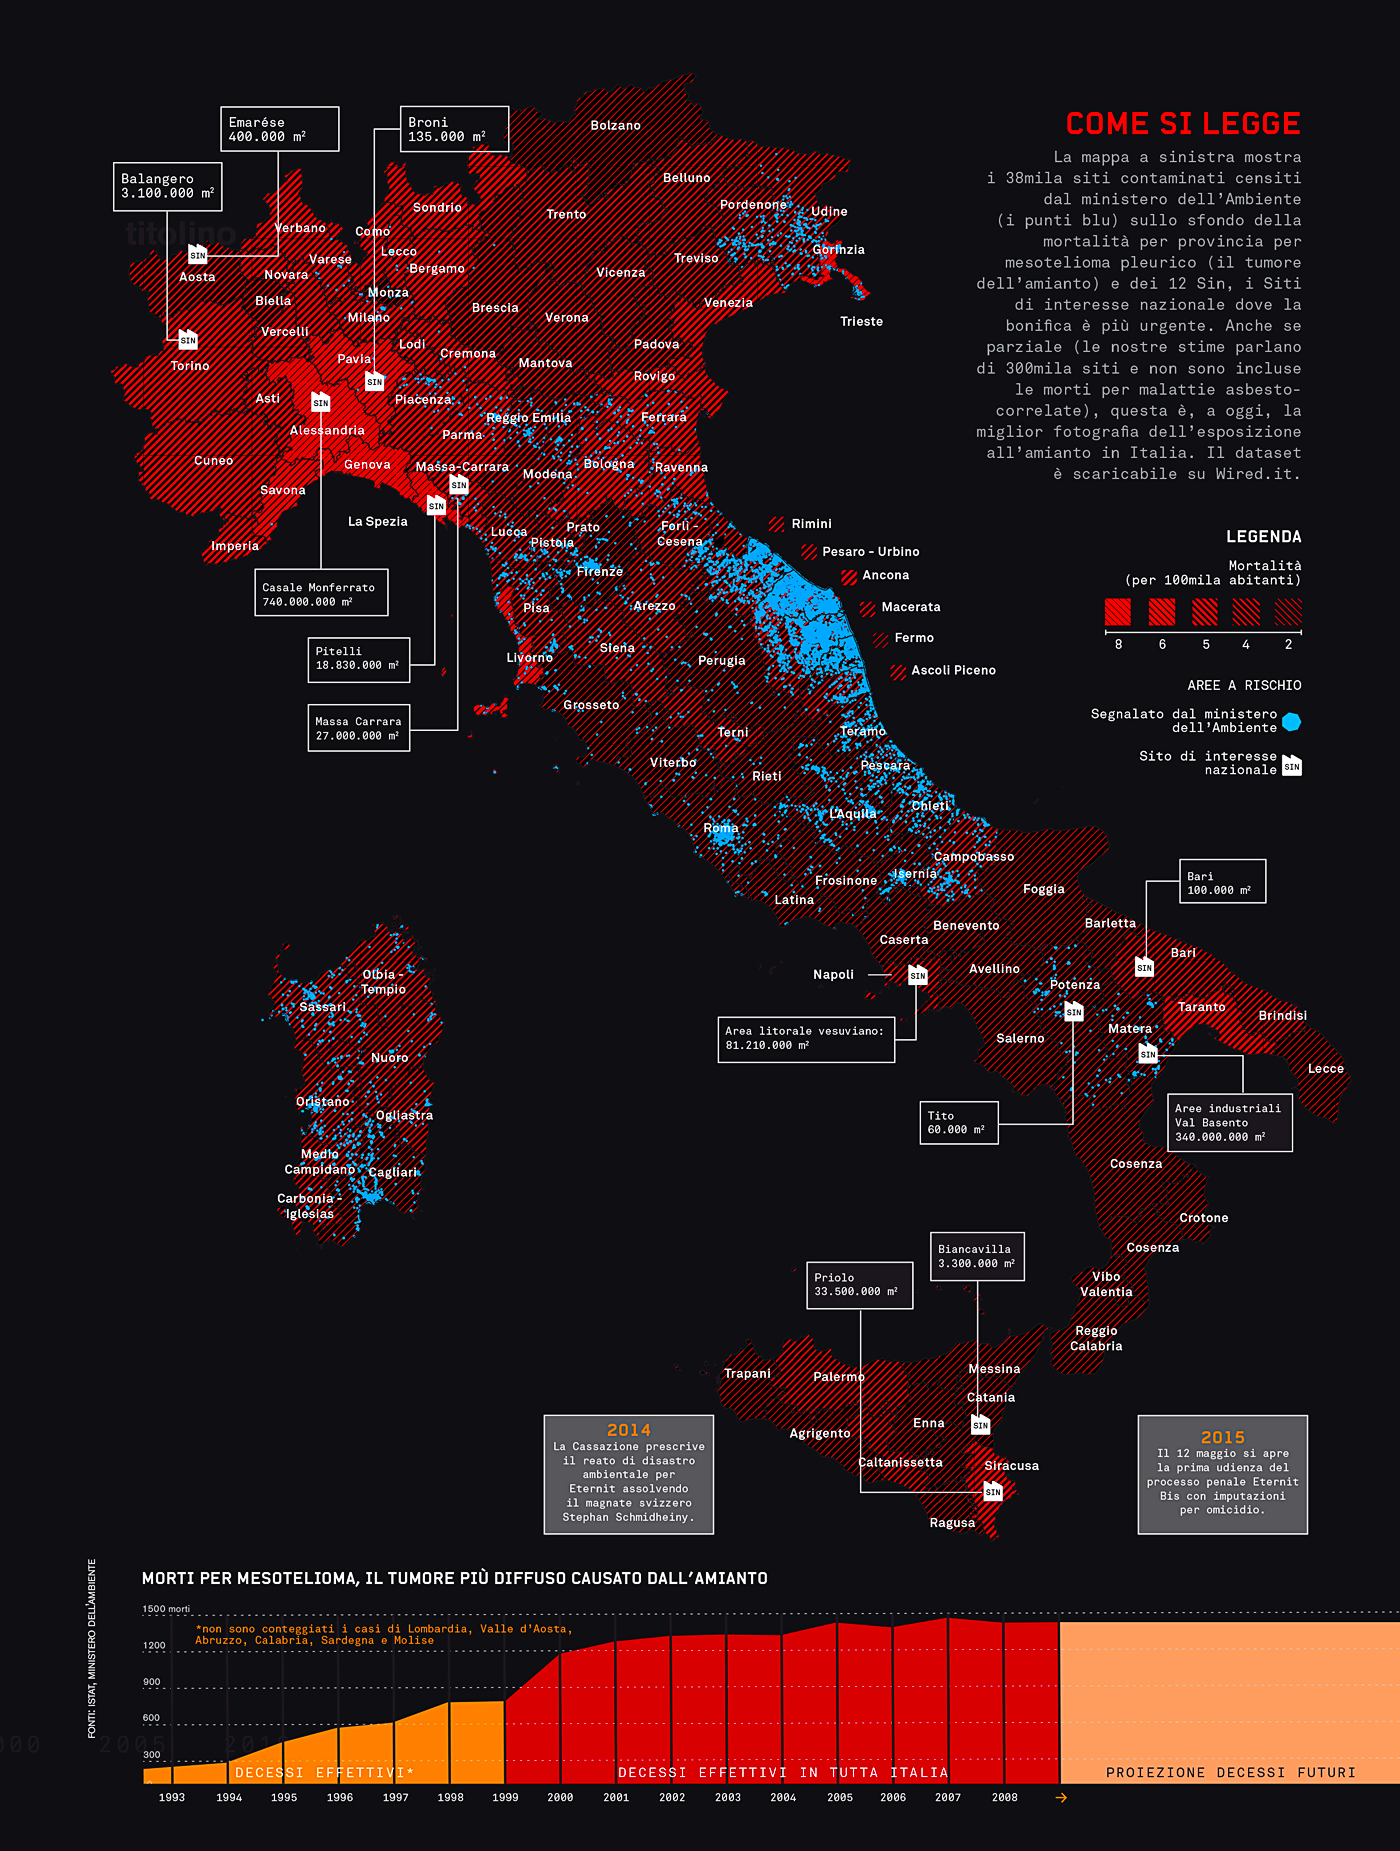
bottom page: Many data are missing, but the people dying is increasing. The tip point will be in 2025, 3000 death by mesothelioma every year.
Workflow
I first use mapbox to sketch, and, later, illustrator to design


Experiments in illustrator with some patterns