URMAP
(This is my own observation through New York City)
The map tells us about the roads, ocean, and hoe the land looks like. However, it takes times to search about the place whether it is city or rural area. Since the urbanization, urban areas tend to have skyscraper or high buildings and rural areas tend to have low buildings or houses. Google Earth helps us to see how it looks even though we don't go there. What if the map tells us about city or rural places by 2d map? It would be easy to decide where to travel or where to live. Sometimes, people don't want to live next to high buildings or sometimes people want to live.
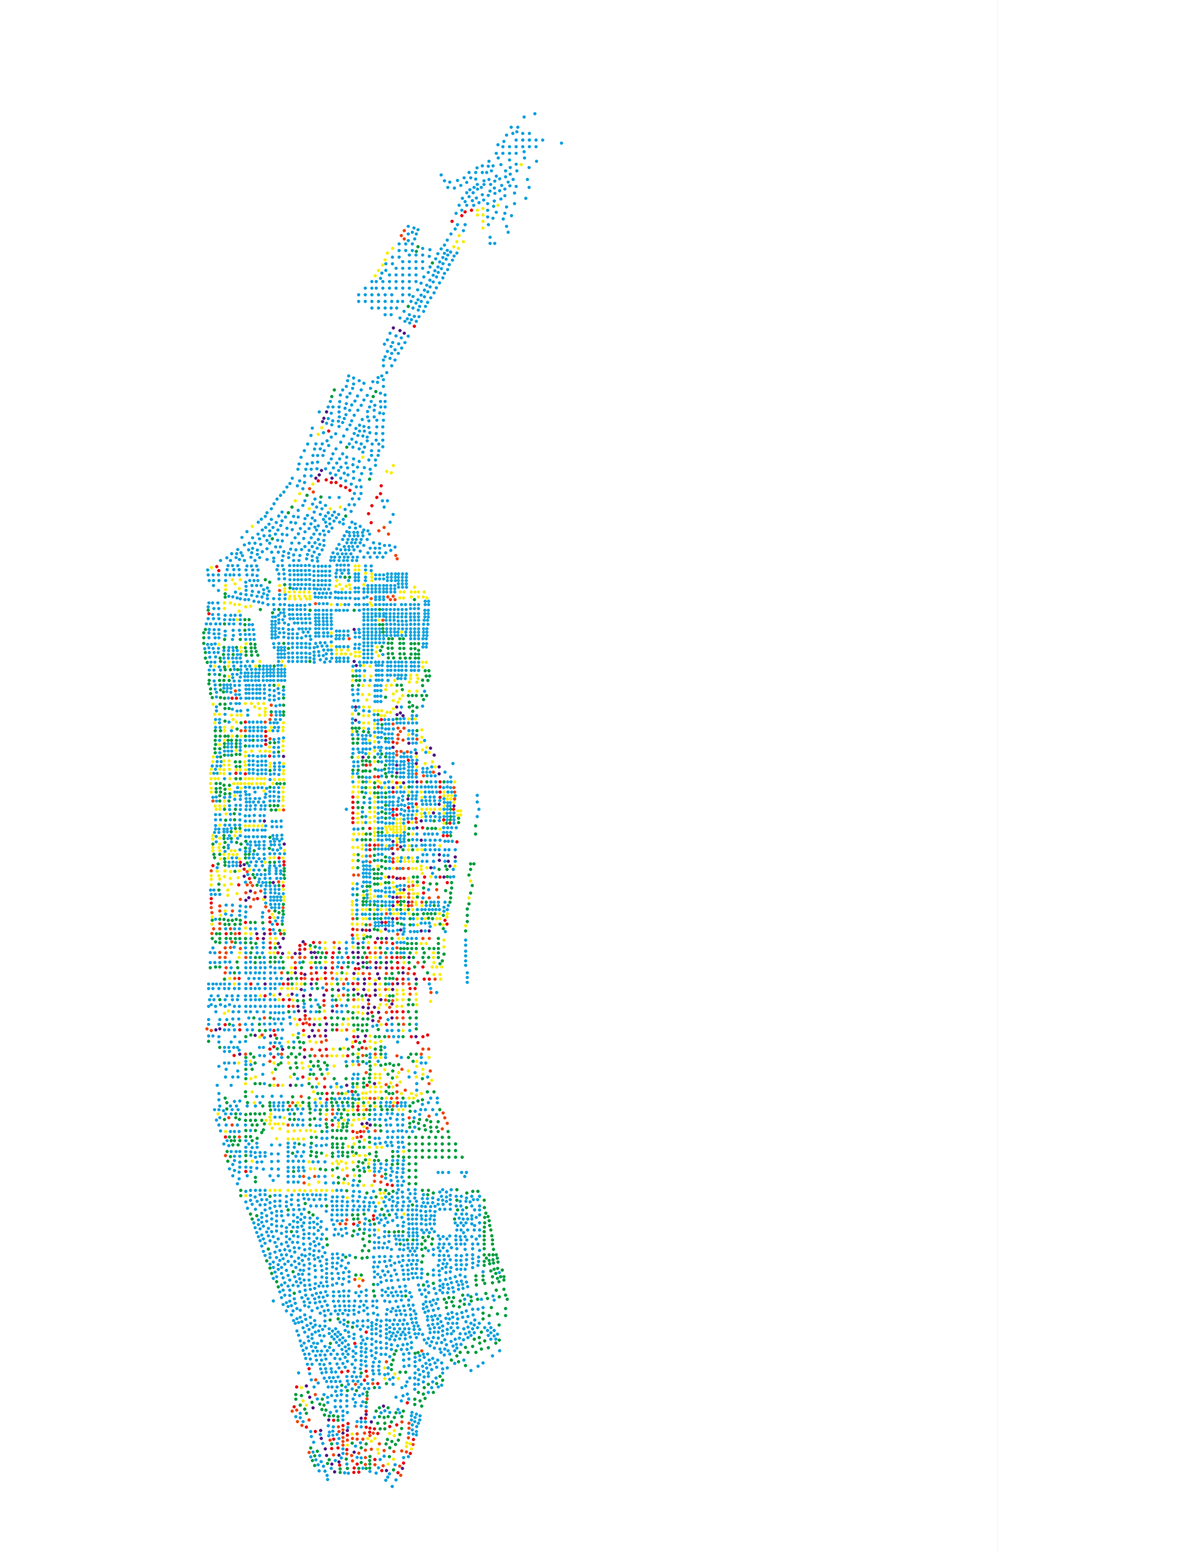
I’ve searched about the color and the map relationship. The inspiration comes from my mother, since she told me about this thing, when I was young. (which some people do not prefer to live next to a skyscraper because it blocks lower buildings’ views. So, they think they live in the shadow of the skyscraper. And so, the price of the apartments could be lower because popularity of the view). The illustration and the color of URMAP is inspired by the weath- er map. The weather is usually illustrated in blue, green, yellow, orange, or red. My idea is to indicate the height of buildings by color dots. 1~10 buildings blue. 11~20 green. 21~30 yellow. 31~40 orange. 41~50 purple. 51~ red. The concept is about the map but since the world is too large, I’m choosing Manhattan or NYC map for this idea as the beginning idea. By seeing URMAP map, people, who would like to move, can easily see the environment of areas.

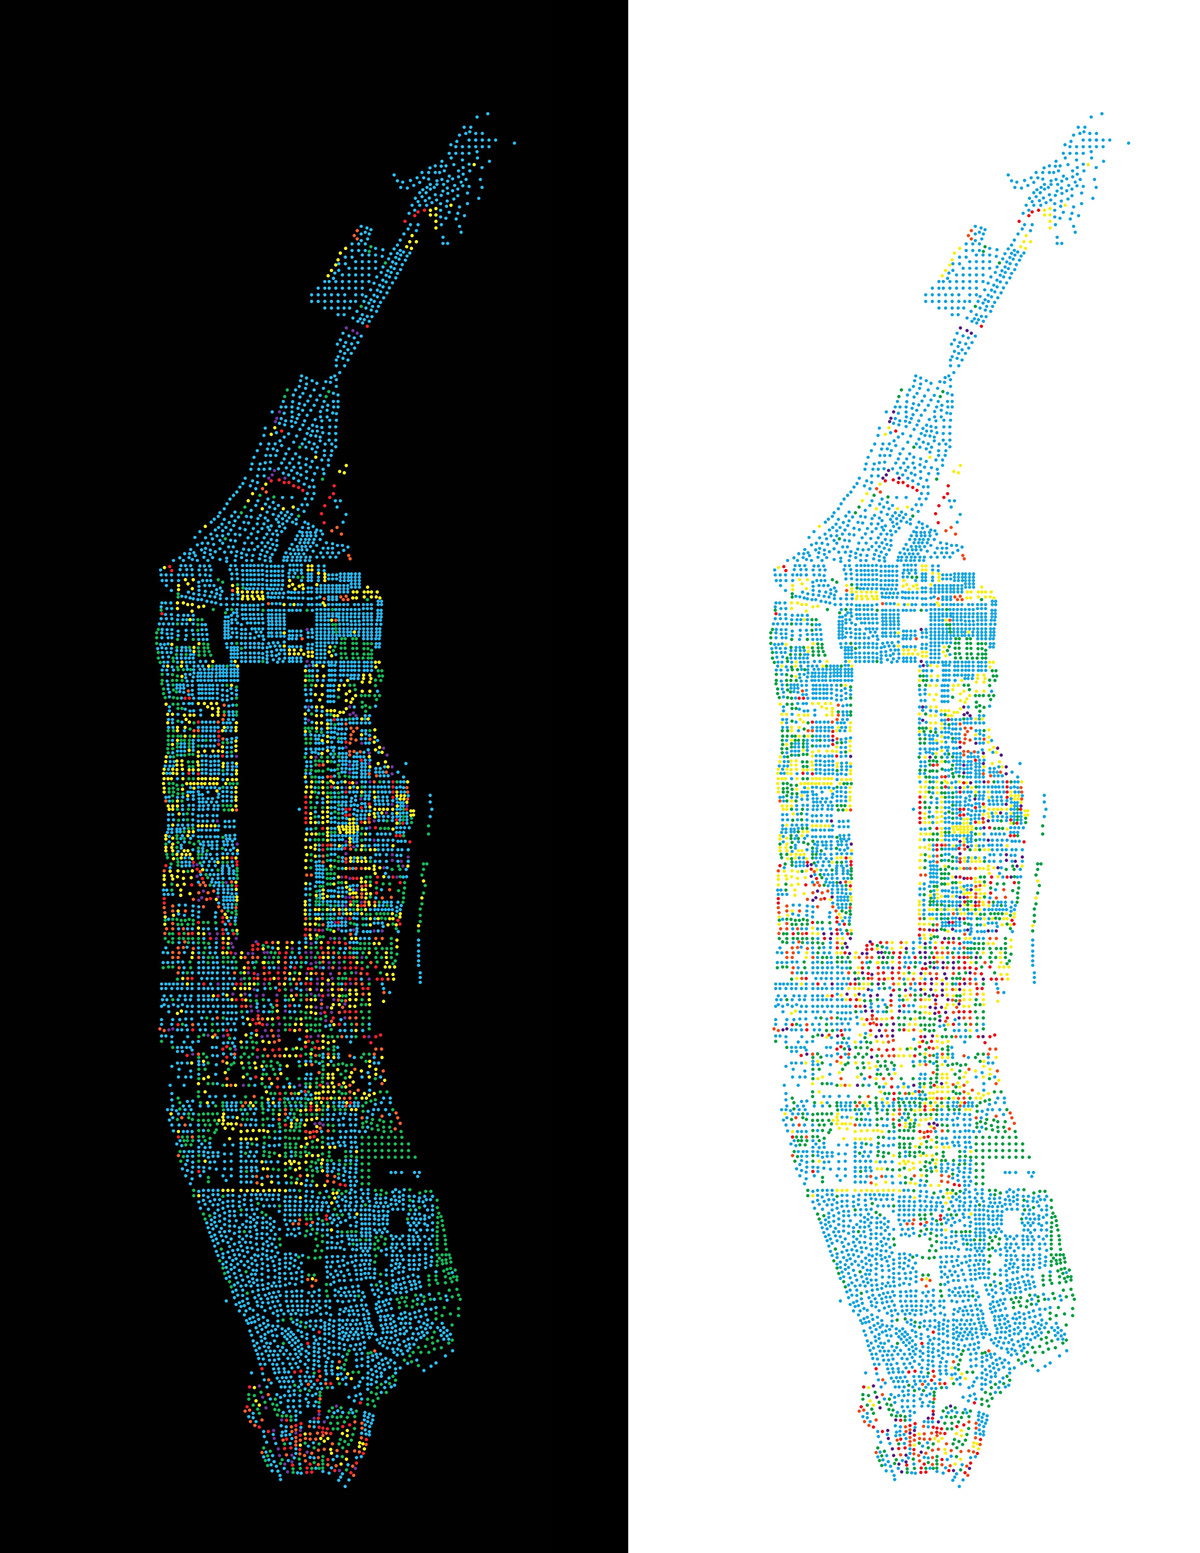

I silkscreened tote bags. Each floor versions are silkscreened.
Inside the tote bag is printed all floors.
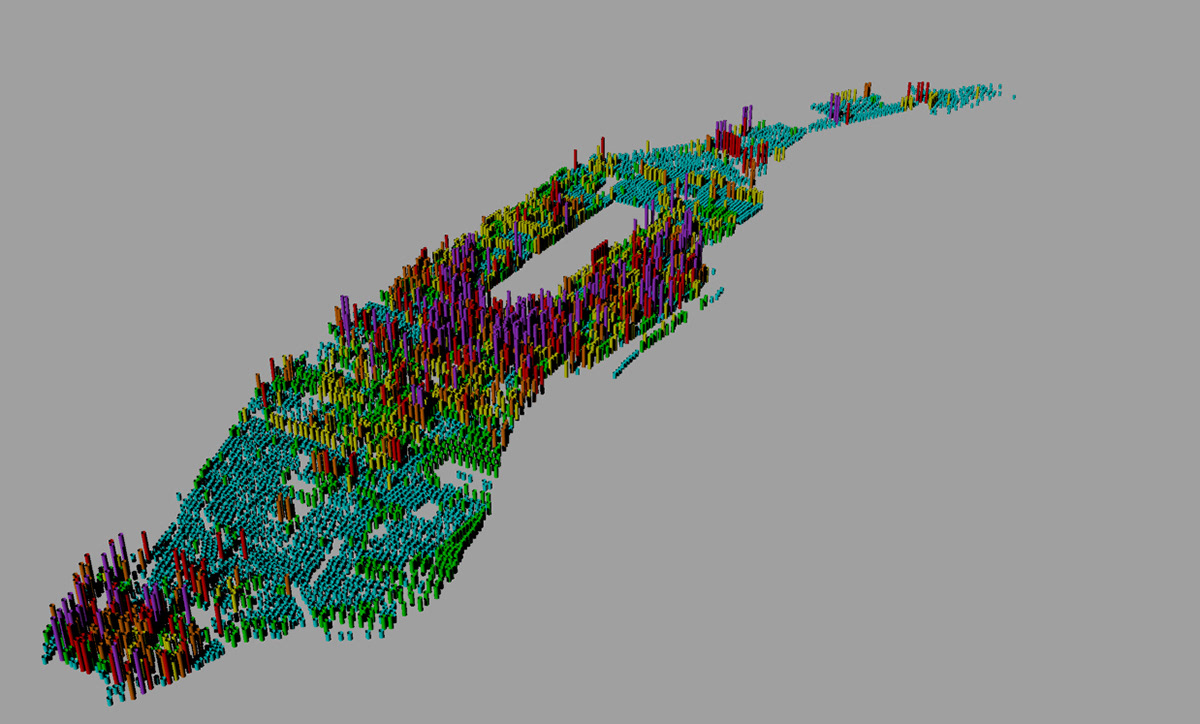
This is 3D version of URMap.

