THE MATHEMATICS OF HISTORY
Spring 2014
Infographics of Mathematic investigates the use of written text expressed over time with in the medium of typography.
I am interested in infographics, so I tried to create the infographic in motion class in 2014.
It was very hard to me is how a story broad ransform to next story broad as well as considering audio rhythm.
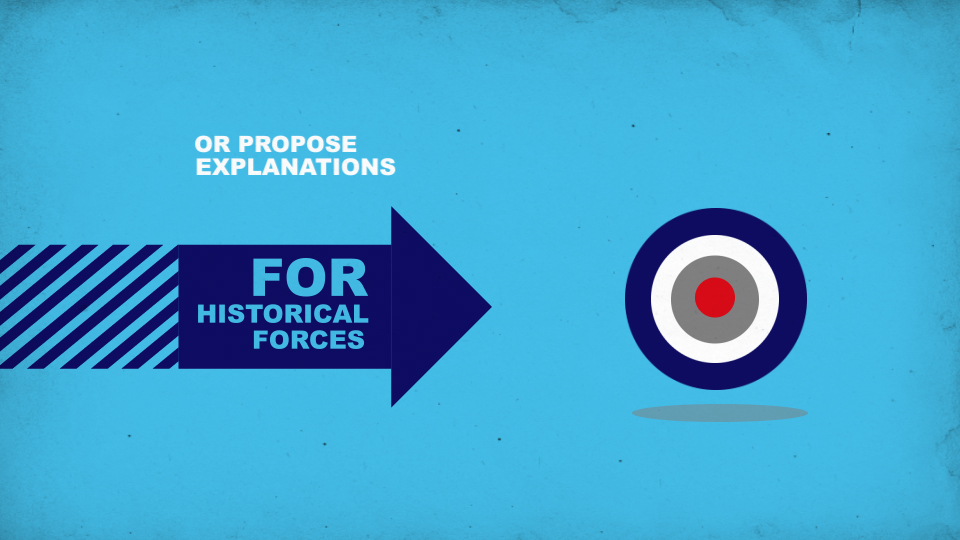
I used blue and red colors, because key words of my motion piece are history, mathematics, and infographics, so blue helps my motion piece explain in functional and logical ways. Red is vivid color, and I used red to point to what is important with audio. (Audio was from Tedtalk. )
------------------------------------------------------------------------------------------------------------------------------------------------------