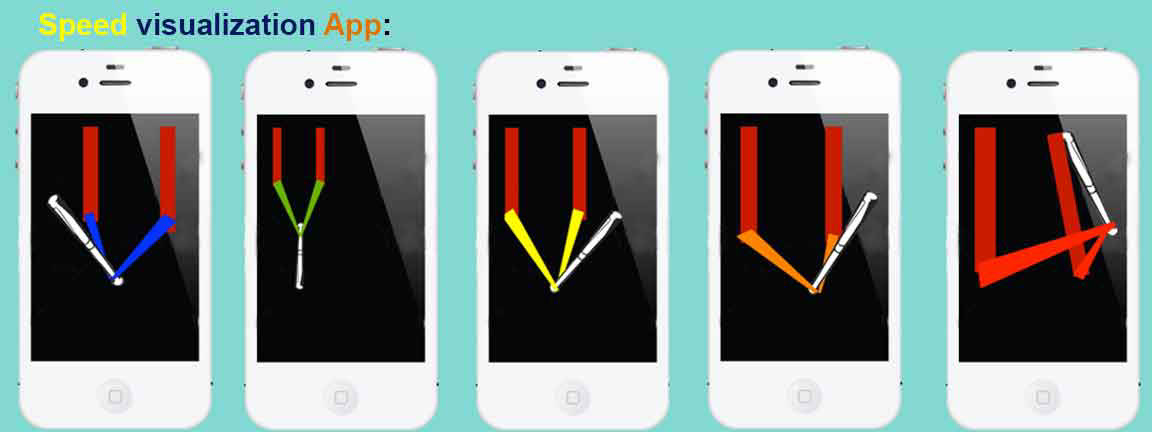
Speed Visualization Apps:
A mobile app to show the speed limits. Data Visualization shown using colored arm. A team presentation by two members (in Interactive design course) have shown Data Visualization using the coloured arms. Created the neopixel flora colors of blue, green, yellow, orange and red shade. This mobile app is to show the speed limits represented by force of arm movements shown in different colors.


